Source: Glassnode; Compilation: Baishui, bitchain vision
summary
-
Bitcoin has entered a correction phase, trading price down 11% from its all-time high of $108,000, but remains above key support, maintaining a constructive market structure.
-
Z-Score analysis shows that cyclical highs are typically consistent with various indicators above the average of 1.5 to 2.0σ, providing a framework to help navigate the bullish market phase.
-
Bitcoin’s current price is about 10% higher than the cost base of short-term holders’ $884,000, emphasizing that there is a downside risk if momentum stagnates and prices fall below this level.
-
Unrealized losses are concentrated on short-term holders, with 2.0-3.5 million BTC being held, reflecting moderate market pressure.
-
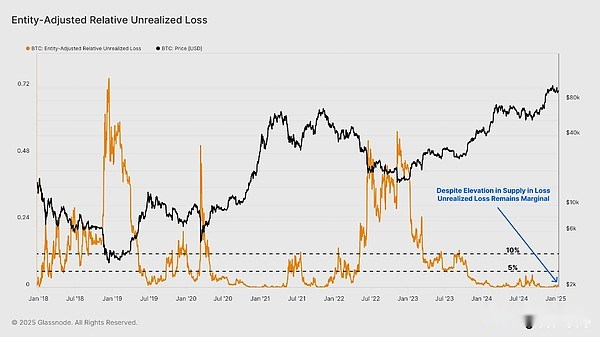
Relatively unrealized losses peaked at 4.3% in the third quarter of 2024, significantly lower than the previous cycle driven by external shocks, highlighting the market being more spot-oriented and more patient.
Change of peak value
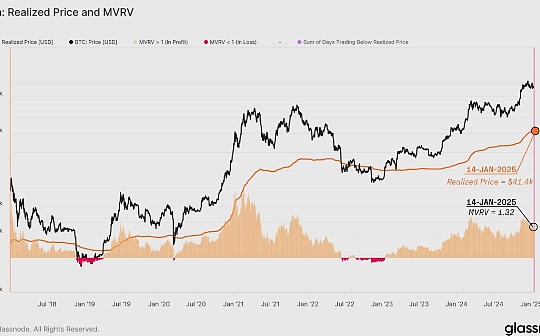
The realized price reflects the average price of all Bitcoins last traded on-chain and therefore represents the total cost basis of the market.The MVRV ratio is the ratio between the spot price and the realized price, which measures the size of the average unrealized profit.Values above 1 indicate average unrealized profits, and values below 1 indicate unrealized losses.
The MVRV ratio currently trades at 1.32, indicating that the average unit of BTC holds 32% of unrealized profits.This structure is similar to the ATH post-structure in mid-April 2024, suggestingDespite the adjustments in the market, overall sentiment remains positive.
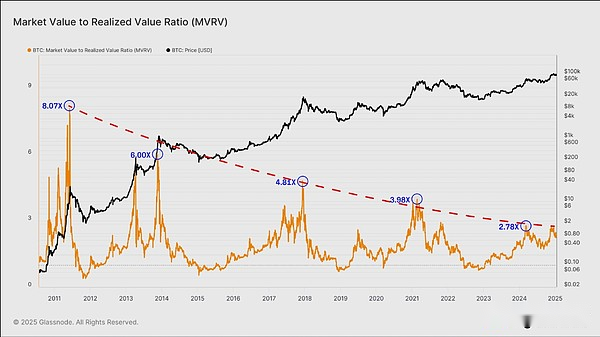
The Bitcoin market has matured over the years, while the peak of MVRV has experienced periodic decay near the cyclical top.This reflectsAs asset size grows, speculative extreme behaviors generally weaken.
The MVRV highs in each market cycle gradually decrease, indicating that the average unrealized profit multiple is decreasing:
-
2011: 8.07 times
-
2014: 6.00 times
-
2018: 4.81 times
-
2021: 3.98 times
-
2024: 2.78 times (so far)
This decline indicates that as the market size and liquidity grow, volatility and speculative intensity gradually decrease.This also shows thatAlthough Bitcoin is still cyclical, each peak becomes relatively less exaggerated, consistent with a more mature and efficient market structure.
To explain the decrease in MVRV peaks over a continuous period, we can use statistical methods to regulate its oscillation range.A widely accepted method in financial time series analysis is the Z score, and its calculation formula is as follows:
Z-Score = (X – μ) / σ
-
X is the observation value,
-
μ is the average value,
-
σ is the standard deviation.
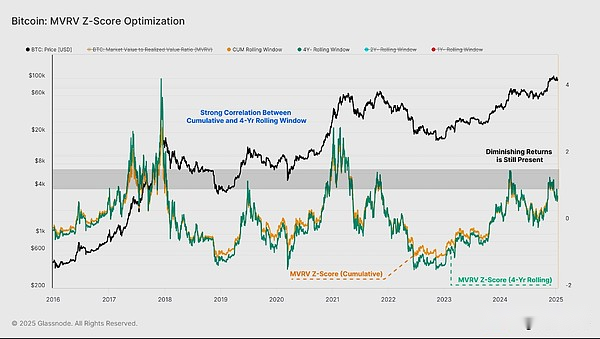
When calculating the Z score, we can use the entire historical dataset for a cumulative view, or we can use a short scroll window to better capture the dynamic nature of the financial cycle and the gradually decreasing peaks in the MVRV.
Using the entire historical data for MVRV Z score conversion may result in some distorted results, as early periods with higher peaks distort the mean and standard deviations, making it inconsistently reflecting the current market conditions.
Therefore, to explain these effects, we optimize the scroll window by shortening the length of the scroll window and using recent market history as a benchmark.
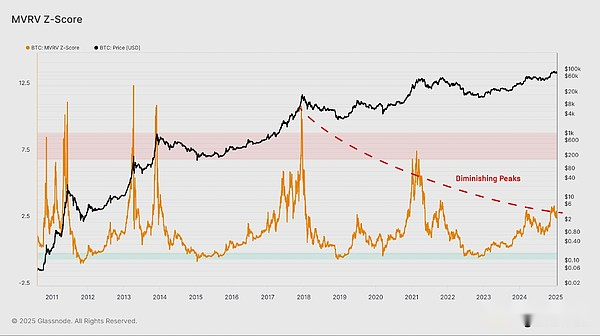
The following figure compares the accumulated Z score with the version calculated using the 4-year scroll window.Despite our attempts to adapt to the dynamic nature of the market cycle, the results are still nearly the same, and the MVRV peak decay problem remains unresolved.
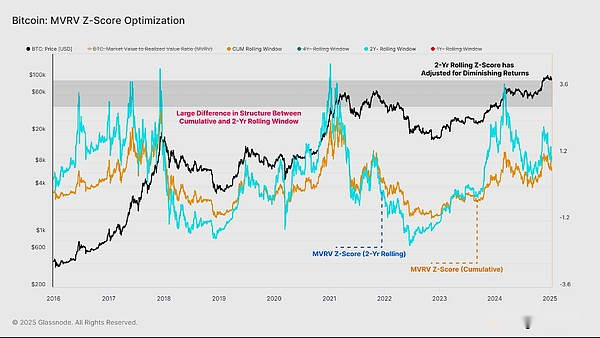
Go to the 2-year scroll window for the Z-score calculation (blue), and the peak observed in the most recent cycle ATH in March 2024 is very close to the peak range of the previous two cycles.
In this case, we have now adjusted the decline in the MVRV peak.However, the 2-year rolling window Z score did not mark significant market highs for the fourth quarter of 2015, third quarter of 2019 and second quarter of 2023, indicating that there may be potential for further optimization.
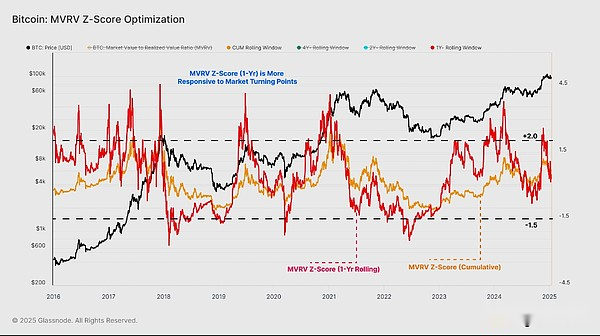
Finally, we applied a 1-year scrolling window in the Z-score calculation, enabling a more accurate and promising transformation.This approach can identify mid- and late peaks at similar scales, thus more clearly representing recent market dynamics.
This 1-year MVRV Z score shows that the cyclical bull market continues to reach local and global peaks in the 2σ range, and investors’ profitability has significantly improved in a relatively short period of time.During the bear market phase, local and global lows are captured when the MVRV trades distance mean -1.5σ.
This improved MVRV Z score can provide a more responsive framework to identify key market turning points throughout the cycle and help adjust for overall peak drops near extreme values.
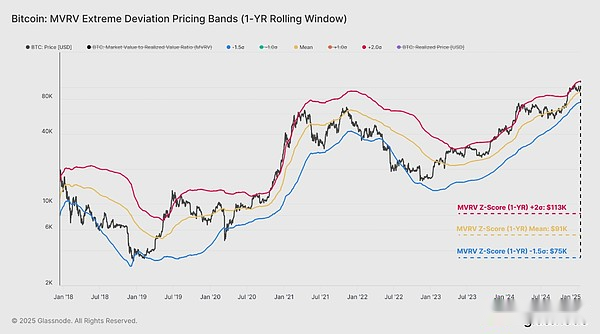
Now that we have optimized the scroll window to 1 year, we can extend this framework to reversely calculate the threshold price levels that define these recent peaks and troughs.
A bull market is characterized by the price trading between the 1-year average, with a peak of around 2σ.On the contrary, bear market prices remain below average, with significant lows appearing around -1.5σ.This structured approach allows for a clearer division of market phases.
Currently, Bitcoin is trading at $94,398, above the 1-year average of $909,000, but below the +2σ threshold of $1.126,000.This suggests that the market is still in a bullish phase, although it has fallen slightly from its recent high level, when it is above the upper limit.
Evaluation correction
The 1-year MVRV Z score model shows that the market cooled down from a strong rebound and we can now assess investors’ earnings by measuring the unrealized losses we hold.This helps measure incentives for market participants and identify key areas of risk that need to be focused on.
First, by analyzing the entity of circulating supply to adjust the cost base distribution, it is clear that all unrealized losses are concentrated on short-term holders—investors who have purchased tokens in the past 155 days (near the peak of the market).
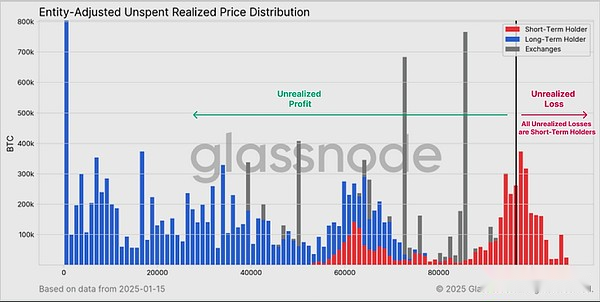
Focus on the pressure on short-term holders as potential sellers, and if the current market decline intensifies, we can look for areas where unrealized losses may become severe.
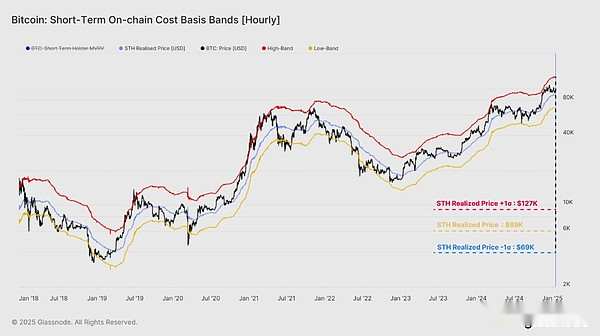
The average cost base for short-term holders is currently $884,000.Based on similar statistical methods mentioned above, we also show the highs ($1.255 million) and lows ($685,000) ranges representing the typical limits of price behavior during bull and bear markets.
Spot prices are currently 9.2% higher than the cost base for short-term holders, indicating that the market is still in the normal state of a typical bull market.However, if the market fails to resume upward momentum, the possibility of falling below the STH cost base will be greater, which can lead to short-term pressure and additional sells may occur if investors start panic.
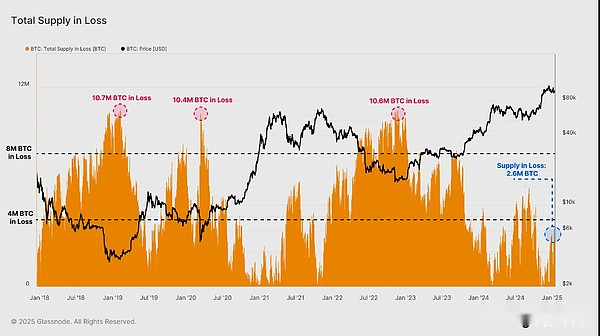
To better measure the level of stress experienced, we can evaluate the supply of BTC currently in an unrealized loss state.From a historical perspective, over the past 10 years, we can observe:
-
During a bull market, the amount of BTC that loses usually remains below 4 million.
-
In the early stages of the bear market, the number of losses in BTC reached 4 million to 8 million.
This week, market volatility caused losses of 2 million to 3.5 million BTC.Although the losses are huge, this range is still lower than the 4 million BTC loss during the local market lows between July and September 2024.This shows thatThe current market may be in a more sluggish state than the previous adjustment stage.
Another dimension that measures the extent of market pain is the relative unrealized loss indicator, which measures the ratio of unrealized losses (in US dollars) to market capitalization.Looking back on the recent cycle, you can findThe current market has similarities with the bull market in 2016-17.
Unlike the 2019-22 cycle, external shocks such as the COVID-19 epidemic will push relatively unrealized losses to more than 10% in the 2019-22 cycle, while this is the only one consolidation phase in the third quarter of 2024.The indicators pushed up to about 4.3%.
It can be said thatThe current market cycle experiences less pressure, which may be due to smaller declines, reduced volatility, and new spot demand through ETFs and institutional investors.
in conclusion
Bitcoin has entered a correction phase, trading at 11.1% below its all-time high of $108,000.However, spot prices are still trading above several key support levels, indicating that the current bullish market structure is still intact.The market dilemma is relatively light, measured by the small historical unrealized losses held by market participants, exacerbating this.
We also show how the MVRV z score optimized with 1-year rolling window provides a framework to deal with the recent bullish and bearish market phases.According to this model, we are still in the bullish zone, although the cost base for short-term holders is still $88,400, which is a key level of maintaining constructive sentiment.