Author: Gwen, Communication Author: Bjeast, ENZO, YOUBI Investment Research Team
About gold, US debt, interest rate cuts, shrinkage and US elections.
Tl; DR
-
Since the end of March, gold is decoupled from the US dollar, and both have risen.It is mainly due to the recent excessive non -US geopolitical emergencies, and uncertainties have led to the rapid rise in global risk aversion.
-
The central banks led by China began to sell U.S. debt blessing gold, suggesting that the trend of local confrontation against the US dollar hegemony and the uncertainty of the demand for long -term US debt.Due to the earlier expectations of other sovereign state -owned state -owned, such as Europe and Switzerland, if inflation continues to stay high, the US dollar will continue.
-
In the short term, due to the expected expectations of the Federal Reserve’s year, the balance of TGA in the Ministry of Finance exceeded expectations in April, which will impact the liquidity of the debt issuance of the Ministry of Finance.Pay attention to the specific amount of debt issuance and short -term debt ratio of the Ministry of Finance.
-
However, from the long -term perspective, the US debt crisis has not been lifted. The current fiscal deficit rate of the US government has soared. The suspension of the upper limit bill will be suspended in January next year.The balance of the TGA account becomes a key indicator, and it should be vigilant at the bank’s reserve rate.
-
Due to the uncertainty of votes and specific policies in the first year of the election, the historical risk asset tendency showed a shock.In order to maintain its independence, the Fed will maintain economic growth as much as possible in the election year, so that the market will maintain abundant liquidity.
-
The US economic performance has strong domestic demand, repeated inflation, and the expectations of economic recession have decreased significantly compared with last year.The institutional “preventive” interest rate cut is expected to be collectively adjusted to the second half of the year and even the year.CME data indicates that the market has the highest expectations of interest rate cuts in September and November, and the expected expectations of the first interest rate cut for December and January will gradually increase.Combined with the annual historical interest rate policy performance, the pre -month interest rate policy (ie September) is usually more cautious.In addition, the sufficient conditions for cutting interest rates are poor employment and weak inflation, and the tightening of the financial market is kept vigilant.
-
The expansion of the table can directly affect market liquidity than cutting interest rates. At present, the Fed has considered slowing down the shrinkage in advance. By slowing down the way of reducing US debt, the market is generally expected to slow down in May or June to hedge the fluidity.Stop the shrinkage, and then usher in the expansion cycle.At the same time, history shows that the probability of steering operations in the short term after the election is high.
1 Gold “decoupling” with the US dollar
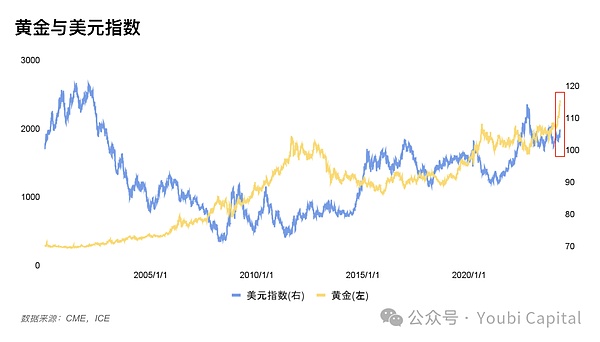
Figure 1: US dollar and gold price trend chart
In the past, the international gold price trend was usually negatively related to the US dollar index, butSince the end of March, the gold and the US dollar indexes have emerged abnormally in the same trend risingEssenceNegative correlations can be explained from the three attributes of gold, namely commodity attributes, currency attributes, and risk aversion attributes. These three need to be discussed in combination.
-
Commodity pricing: Price currency strengthening will reduce the price of the gold of the priced material (the same reason for the commodity)
-
Financial attributes: Gold is an alternative to the dollar and a potential alternative to the decline of US dollar credit.When the US dollar is weak, investing in gold may get higher returns;
-
Risk aversion attributes: Usually the strong dollar shows that the economic fundamentals are strong, so the demand for hedging assets has declined.But the US dollar as the world currency also has a hedging attribute.Need a specific risk and specific discussion.
1.1 Gold soaring
The recent rise in gold prices has attracted a lot of attention. There are two main reasons here.
1)Market risk aversion caused by geopolitical warfareEssenceMoscow air strikes, Israeli air strikes in the Iranian embassy in Syria (direct fuse), Iran’s direct attack on Israeli native land, etc., has begun to increase the demand for gold purchases all over the world. This is one of the pushers in the short term.
2)The central banks of various countries continue to purchase gold to enhance demandEssenceIn order to avoid the risk of US debt,Some central banks began to reduce their holdings of US debt and increase their holdings, Thus pushing up the price of gold, which also reflects the crisis of trust in the US dollar from the side, and may evolve into the US dollar in the future.For example,China Central BankThe gold reserves increased by 10 tons in January, which increased gold in the 15th consecutive month. At present, the total amount of gold reserves is 2,245 tons, which is nearly 300 tons from the announcement of the additional storage at the end of October 2022.
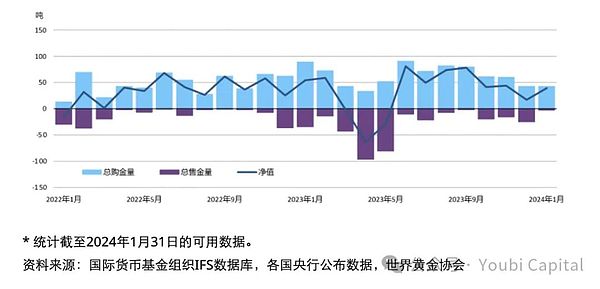
Figure 2: Global Central Bank purchase gold trend
https://china.gold.org/gold-focus/2024/03/05/18561
1.2 USD index rises
1) The steady economic domestic demand in the United States has delayed interest rate cuts.The economic data of the United States 23 years of Q4 indicates that the current economy has a certain toughness. The 24 years Q1 shows that the current US supply is in short supply and needs to rely on overseas imports.And the repeated data of inflation reduces the necessity of interest rate cuts, and the demand for stable US dollars to maintain a tightening monetary policy has prompted the US dollar to rise.
2) The US dollar is passively rising due to international exchange ratesFor example, Switzerland unexpectedly cut interest rates.If other currencies have a currency loose policy, the exchange rate of the US dollar has risen compared to other countries due to the spread, and then pushes the US dollar index.
3) As a world currency, the dollar undertakes some risk aversion needs.When the local crisis does not involve the United States, the US dollar’s hedging attribute will be partially revealed, and at this time as the golden effect.
1.3 Why are both strong and stronger
Reasons 1: Both the dollar and gold have the attributes of risk aversion assets. When emergencies occur in the concentration of emergencies and cause the geopolitical crisis or economic crisis to deteriorate, the market risk aversion is too strong, and a two -strong situation will be formed.At the same time, the impact of gold’s goods and financial attributes is less than the risk aversion attribute.For the US dollar, the United States has maintained a tightening monetary policy, while other economies have weakened currencies and support the US dollar to strengthen.Similar situations have also occurred in history, such as the failure of the US -external intervention in 1993, the European sovereign debt crisis in 2009, and the unstable situation in the Middle East.
Reason two: Although the US dollar shows a strong trend in the short term, some central banks’ behavior of minusing US debt and increasing gold in some central banks also implies the resistance to the US dollar hegemony.Should be alert to the US dollar credit crisisEssence
From the perspective of the trend of gold, the trend of gold in the short term depends mainly on whether Iran will retaliate on Israel on a large scale.From the perspective of the US dollar index trend, some other sovereign currency currently has earlier interest rate cuts, such as euro and pounds, and the Swiss Central Bank has cut interest rates in advance.Among them, the US dollar still has a spread space, and it may still have a certain support in the future.
2 Have liquidity risk uncertainty
2.1 Market liquidity is blocked
The liquidity of the financial market is an important indicator of our future market trend.At the beginning of the year, the Mavericks market also increased due to the liquidity of the BTC ETF through the flow of traditional funds and the Federal Pigeon speeches, which led to a short -term rise in liquidity. Finally, the overall financial market lacks liquidity.
The financial market is often passedReal liquidity indicator = Federal Reserve Liabilities -TGA -Reverse Repurchase = Deposit of Financial Institutions + Currency Currency + Other Liabilities, Measure market liquidity.For example, in the figure, we can findThe previous round of cycle BTC was positively related to financial liquidity indicators, and there was even an excessive trend.EssenceTherefore, in an environment with abundant liquidity, market risk preferences will be improved, especially the impact of the liquidity of the encryption market will be magnified.
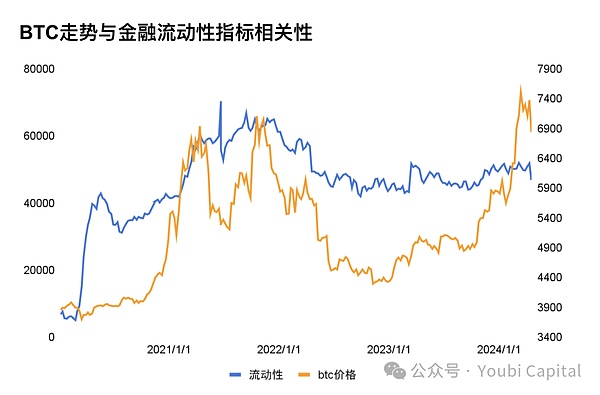
Figure 3: BTC and financial liquidity indicators
The recent decline in the scale of reverse repurchase is mainly used to offset the decline in liquidity brought by the Federal Reserve’s shrinkage of US bonds and the Fed. March liquidity release is mainly contributed by reverse repurchase release.However, the scale of reverse repurchase continues to decline, and the Fed currently maintains a scale of 95 billion yuan per month.At the same time, in order to cope with the arbitrage space caused by low interest rates, the BTFP interest rate has been adjusted from January 25 to not lower than the reserve interest rate.After the arbitrage space is narrowed, the amount of BTFP has turned to fall, which cannot further increase the scale of the Federal Reserve’s balance sheet.In addition, the current tax season is currently facing the tax season. The short -term rise of the TGA account has reduced the overall market liquidity. Since 2010, the median ring ring of the TGA account in April has increased by 59.1%month -on -month, and it will gradually return to normal over time.
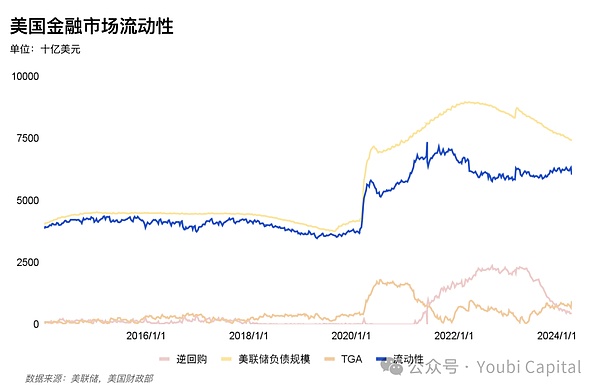
Figure 4: US financial market liquidity
In summary, in the short term, after the tax season ended in May, TGA growth exceeded expectations, and the agency predicted that the Fed will start to relieve QT progress in the middle of the year and ease liquidity tightening trends.However, in the middle and long term, the market lacks new growth momentum of liquidity. The US financial liquidity has continued to decline to further affect the risk assets when the US financial liquidity has continued to decline.The uncertainty of sexual risks will bring a certain downward risk for technology stocks, encrypted assets and even commodities and gold.
2.2 US debt risk
The high volatility of the US debt was an important cause of the “Three Kills of the Second Treaster” incident in March 2020. The recent surge in US bond yields has once again exposed the potential issues of imbalance in supply and demand in the US bond market.
2.2.1 Supply Superford
In 2023, the deficit rate reached -38%, an increase of 10%year-on-year.EssenceThe fiscal status of high debt and high deficit caused by the epidemic is superimposed. The total weighted average interest rate of the total unsuccessful debt in the 2023 fiscal year is 2.97%, which continues to increase the total interest that the United States needs to repay.In 2023, US debt was 264 trillion yuan, and the US debt was 59 trillion yuan in 2024, and the current total reached 3.4.58 trillion.
In the short term, the re -financing expectations given by the Ministry of Finance on April 29 showed a trend of increasing issuance, and specifically to track the quarterly -re -financing plan officially released by the Ministry of Finance.Although institutions represented by Nomura predict that due to the increase in wage levels last year, the tax revenue income of the Ministry of Finance in April increased, and the current TGA account of the Ministry of Finance increased significantly, which is 205 billion US dollars than expected. Yellen may reduce financing expectations.
In the middle and long term, the market is generally expected that there will be 2.5 trillion bond issuance in the United States this yearThen this year will also be released from 141.91 trillion, the average and the speed of the 24-year Q1.On January 1, 2025, the “suspension of the upper limit of the US debt debt” will be stopped to prevent the re -acting of the US debt crisis.Before the end of the suspension of the debt issuance, the Ministry of Finance had motivated to issue a sufficient amount of US bonds to ensure the short -term government expenditure and normal operation after the suspensionEssenceWall Street predicts that no matter who won in the November presidential election, the US government will continue to issue a large number of bonds.
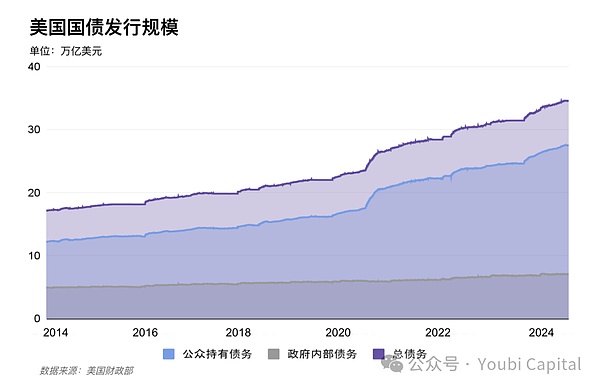
Figure 5: The scale of US debt issuance
2.2.2 Weak demand
Foreign investors and the Fed are the largest buyers of US debt, and they account for half of the market share of Half of US debt.Although the Fed is currently considered to slow down the shrinkage, the two have stopped increasing holdings of US debt since 2022, and the supply pressure is passed on to domestic investors in the United States. The residents’ sector purchases the investment amount has expanded significantly.Domestic investors are more inclined to short debt, and they have limited volume and large volatility.The current issuance of short debt has exceeded the ideal range. Since the suspension of debt limit in June 2023,The short-term Bills of the Ministry of Finance accounted for 53.8%(85.9%in November 23), and the Borrowing Consultation Committee of the Ministry of Finance suggested that short-term bonds should remain at 15-20%.
& lt; long debt buyer & gt;
The Federal Reserve shrinkage process continues. In the 22nd Q1-23 Q4, a total of 1016B has been reduced. In the short term, it may slow down the process of shrinkage but not suddenly turning.According to the FOMC meeting in March, FOMC all agreed that the monthly shrinkage scale was reduced by about half, MBS reduced the upper limit unchanged, and US Treasury bonds were reduced.If the Federal Reserve has recently slowed down the table as scheduled, hedge part of the demand for long debt.
Japan, China and Britain’s top three buyers hold more than 1/3 foreign investors hold US debt.The demand for major foreign investors has picked up at the end of 23 years, but it has recently revealed a downward trend again. In particular, China has sold 20 billion US dollars in debt again two months ago.
-
Several major economic entities have strengthened the changes in local monetary policy and the current US dollar index. The European Central Bank expects interest rate cuts in June.The currency authorities have chosen to sell U.S. debt to maintain their sovereign currency exchange rate stability;
-
Recently, the United States inflation has been repeated. Some central banks represented by China sell US debt to increase their holdings and increase their gold.
-
The uncertainty of the geopolitical crisis also affects the demand for US debt.
As a result, if the Fed slows down in advance, the US dollar has begun to weaken or geopolitics relief, or restore part of the lengthDemand for Duan American debt.
& lt; Short debt buyer & gt;
The residential department’s debt purchase is unstable, and individual investors and hedge funds have eased the current imbalance of supply and demand.However, domestic individual investors have the upper limit of purchases. At the same time, hedge funds are sensitive to interest rates, are affected by the market, and have a lot of selling. Therefore, the needs of the future residential departments will have the upper limit and instability.
The liquidity buffer caused by the larger short debt comes from the currency fundThe characteristics of monetary funds are flexible access. The demand is a short -term government bond of overnight repurchase or short -term Treasury bonds in the half -year period.At the same time, the floating loss of currency funds can easily cause market crowding, so in more cases, tend to choose overnight reverse repurchase with more stable interest rates. In the future, the US bond market fluctuates a lot.Essence
After the Monetary Market Fund has suspended the upper limit of the US debt in Q2 in 2023, it has increased its holdings of 203 billion short -term US debt.By transferring ON RRP to accept the demand for some short -term US debt, the inverse repurchase scale in 2024 decreased again by 271B. Morgan Stanley expects that the scale of reverse repurchase will fall to zero in August, and the Fed will reduce QT in June.However, it does not exclude the Federal Reserve to slow down the shrinkage in advance, and then move the time point of zero repurchase scale to Q4.
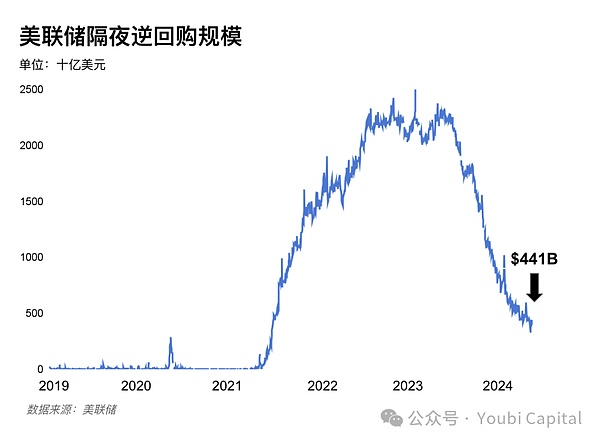
Figure 6: Federal Reserve overnight repurchase scale
In summary, there are many medium- and long -term factors that lead to imbalances in supply and demand.EssenceIf the Fed began to slow down the process in May, the US dollar began to weaken or geopolitics to ease, and the opportunity to alleviate the US debt crisis from the demand of long debt.However,The decline in the decline in the inverse repurchase will not twist in the short term,After the reverse repurchase regulations are close to zero, the TGA trend will become a key indicator of liquidity, and at the same time, be vigilant against the reserve ratio of US deposit institutions.
3 Monetary policy trend
3.1 The impact of the US election on risk assets
The biggest force for the American election for risk assets is the first two months (September-October) and the next month (December).In the first two months, due to the uncertainty of the election results, the market was usually revealed to risk aversion emotions. This situation is particularly obvious in the years with low competitive fierce votes, such as 2000, 2004, 2016 and 2020.After the election landing, the market tendency rebounded with the fading of uncertainty.The influencing factors of the election year need to be combined with other macro factors.
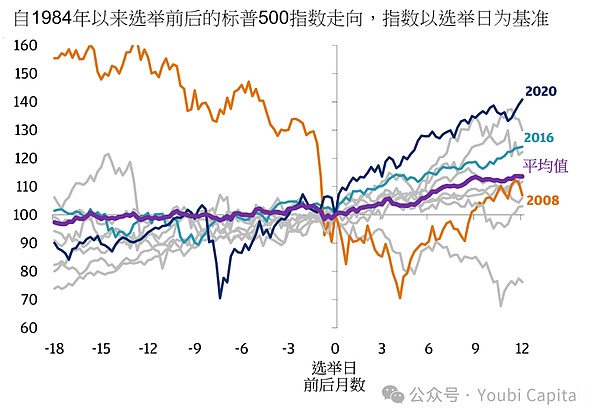
Figure 7: The S & P 500 Index direction from the election date, from JPMORGEN
https://privatebank.jpmorgan.com/apac/Insights/markets-nvesting/3-Election-Ear-myths-debunked
Bank of America analyst Stephen Suttmeier (Stephen Suttmeier) analyzes the average monthly return of the annual S & P 500 index. The result shows that the monthly growth month in the election year is usually August, with an average increase of more than 3%, the winning rateIt is 71%.Subsequently,.At the same time, December is usually the month with the highest profit opportunities, with a win rate of 83%.
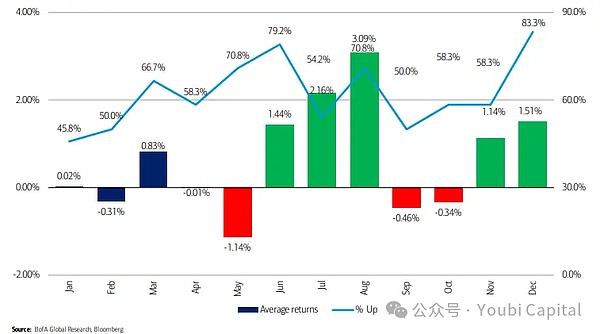
Figure 8: Average annual return on election, from Bank of America analyst Stephen Sutmel
https://markets.businessInsider.com/news/stocks/stock-market-2024-outlook-tlayBook-FOR-CRUCTION-EER-2024-1
In addition to the results of the difference between the voting differences/party disputes, there are specific policy differences between candidates.In 2024, Biden and Trump were still the main candidates, and the economic policies of the two also had large differences.
-
Biden’s re -election will basically maintain the status quo, continue to levy higher corporate taxes to alleviate deficits, but the situation of the stock market from fundamentals.At the same time, compared with Trump,Biden retains greater independence for the Federal ReserveEssence
-
Trump advocates comprehensive tax cuts while increasing infrastructure expenditures. During the previous term, effective tax income tax decreased significantly, and at the same time, the deficit rate rose rapidly, thereby increasing the pressure of US debt.At the same time, the coordination of monetary policy and fiscal policy or increased, the risk of inflation will exist for a long time, and accelerate the damage of US dollar credit.
3.2 Federal Reserve’s interest rate cut forecast
The normalization of interest rates depends on economic fundamentals (such as growth, employment and inflation) and financial conditions.Therefore, the market’s expectations for the Federal Reserve’s interest rate cuts are mostly “preventive” interest rate cuts. Through the strong or recession of the US economy, it is often easy to be affected by the Fed’s repeated impermanence management.
Does the US economy need prevention?From the current GDP data, the economy is stable, the possibility of recession is small, and the demand for preventive interest rate cuts is postponed.After the fourth quarter of the United States, the actual GDP was 3.4%month -on -month after the quarterly adjustment, which was 0.2 percentage points from previously increased. The actual personal consumption expenditure increased by 3.3%month -on -month.Even the GDP data before the correction is in a state of economic growth (the Q4GDP in 2022 has increased by 2.9%).Although the GDP data of Q1 in 2024 was reduced to 1.6%, the reason for the decline was mainly from the high increase and the weakened inventory, indicating that the current US internal demand is still stable, and the market situation of internal economic supply is in short supply.thus,Major professional financial institutions have moved back to interest rate cuts. Goldman Sachs expects that in July, Morgan Stanley also believes that after June, CICC forecast interest rate reduction nodes are postponed to Q4.
According to the latest pricing of CME interest rate futures, traders currently predict that the possibility of reducing interest rates at 25 base points in July will drop to 28.6%, and the 25 base points at the 25th rate of interest rate cuts in September will reach 43.8%, and the 25 base points of November will reach 43.6%.thus,The market is close to the expectations of interest rate cuts in September and November, but the expected expectations of the first interest rate cut for December and January the following year are increasing.
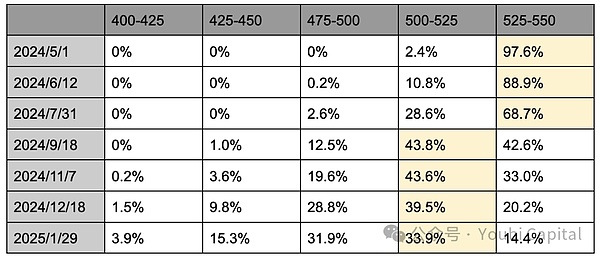
Table 1: The expected distribution of interest rate cuts at CME, as of 2024.4.29
butThe advent of the interest rate reduction window undoubtedly requires non -agricultural employment poor and inflation data.That is, the economic cooling, or financial conditions are tightened again.The uncertainty comes from the US election in November. First of all, the Federal Reserve changes the monetary policy before the election is suspected of affecting the election results.The decision to cut interest rates in September will be more cautiousEssenceAt the same time, it does not rule out that some Fed officials maintain “pigeon preferences” in order to maintain growth and employment, and support interest rate cuts when economic data is still tough.But from a historical point of view, the study of the US elections and US monetary policy in the past 17 times showed thatThe Federal Reserve has a low probability of steering operation before the election (before November of the year), and the probability of turning the steering operation in the short term after the election is relatively highOnly two times have changed from a year of interest rate hike to interest rate cuts, and the federal fund interest rate or monetary policy will occur after four times after the November election month.
In summary, the US economic domestic demand is stable, the inflation is repeated, and the interest rate cut for financial institutions generally moved the next half of the year or even next year. CME data shows that the expected interest rate reduction expectations in September and November, but the chances of December and January of the following year are rising.However, the sufficient conditions for the alert to pay attention to interest rate cuts are poor economy, so there may still be a financial market tightening before the end of the interest rate cut policy.At the same time, from a historical point of view, the interest rate policy and monetary policy (that is, the interest rate cut in September) before the election month are more cautious, and the possibility of turning in the short term after the end of the election month is higher.
3.3 Federal Reserve Shielding Period
Expansion is more intensive than the role of interest rate cuts?
Most of the current market attention focuses on interest rate cuts, but in factThe direct impact of expansion on market liquidity is greater than interest rate cutsEssenceThe above mentioned market liquidity index = Federal Reserve liabilities -TGA -inverse repurchase scale.The expansion of the table is the Fed’s expansion of the balance sheet. To purchase the assets such as government bonds or mortgage to support securities through liabilities, to increase the reserve and currency in the banking system, and create the currency increase to directly expand the market liquidity. Therefore, it is also called it.For “printing money”.The interest rate cut is to reduce the cost of borrowing, motivate enterprises and individuals to increase investment and consumption, and transfer funds to the risk market to increase liquidity.
When will the monetary policy be changed?
The progress of the normalization of the balance sheet depends on the supply and demand of the reserve. According to the article “Scarce, Abundant, OR AMPLE? A Time-Varying Model of the Reserve Demand Curve” published in 2022: “The reserve demand curve is non -linear, and the amount of sufficient measurement of the reserve to the bank asset ratio is measured. 12%to 13%is an excessive abundant and moderate critical point, and 8%to 10%is a lack of warning line.“The performance of the financial market is often non -linear. This has been reflected in the market. After the 2018 reserve ratio is close to 13%, it has fell to 8%quickly. When the Fed announced that the speed of shrinkage has fallen to 9.5%, eventuallyThe expansion table was restarted in October 2019.
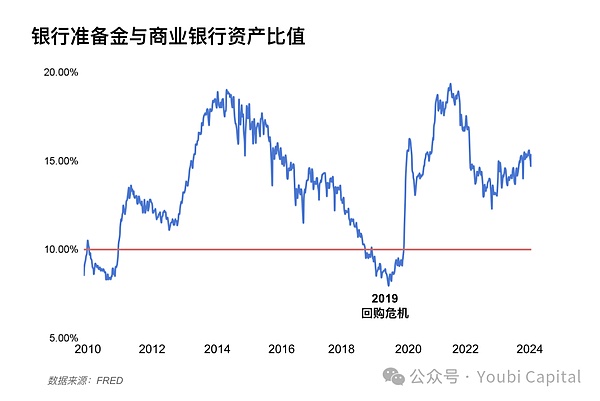
Figure 10: The ratio of bank reserve to total assets of commercial banks
At present, the US reserve ratio has reached 15%, which is still in a state of excessive abundance. As liquidity tighten the back repurchase, the reserve rate will continue to decline.The institutional tendency predicts that the shrinkage will be ended early next year, Goldman Sachs is expected to reduce QT in May, and the shrinkage watch will end in Q1 2025.Morgan Stanley believes that when the inverse repurchase is close to qt at zero, QT will be completely ended in early 2025.CICC forecast will reach the critical point at the Q3, and if the Federal Reserve’s early speed reduction in May, the critical value can be postponed to Q4.At the same time, from history, the Fed has tended to turn currency steering in the short term after the end of the US election month.
In summary, the Federal Reserve has released the signal of slowing down the reduction table,The market generally predicts that the shrinkage will be slowed in May or June, and the QT will be stopped at the beginning of next year, and then the expansion cycle will be ushered inEssenceThe current risk uncertainty still lies in the increase in US debt supply, and the inverse repurchase standard is close to zero and leads to a significant fluctuation of the US Treasury bond market.Especially in the stable personality of the annual economy of the election, the Fed may stop the shrinkage in advance in order to avoid the emergence of the “repurchase crisis” in 2019 and the schedule expansion schedule in advance.
4 summons
Gold and the US dollar have recently emerged with both upward trends. In addition to geopolitical emergencies, they should keep paying attention to the trend of selling US bonds to increase their holdings in some central banks, implying that localization of the US dollar has occurred.
In the short term, due to the increase in TGA balances and the Federal Reserve’s alleviating surface, the expected liquidity tightening caused by hedging US debt issuance must be paid attention to the total amount of financing and short -term debt in the second quarter.In the medium and long term, the supply and demand of the US debt was not cured.Due to the high -rise deficit rate and the suspension of the upper limit next year, in 2024, there is still a large number of US debt issuance demand.The inverse repurchase standard will maintain a downward trend, and then we should maintain the trend of the balance of TGA and the non -linear decline in the bank’s reserve rate.
The US economic domestic demand is stable but inflation is repeated, and the expected expected expectations of interest rate cuts are generally postponed until the end of the year.Stopping the scales is still at the beginning of next year.Combined with history, monetary policy tends to be vigilant before the US election, and the probability of turning in the short term after the election is relatively high.