Author: CryptoVizArt, UkuriaOC, Glassnode; Compilation: Tao Zhu, Bitchain Vision
summary:
-
Although prices have been volatile and sideways since March, both Ethereum and Bitcoin markets have shown relatively strong after a long-term consolidation after ATH.
-
The U.S. Securities and Exchange Commission’s (SEC) approval of the Ethereum spot ETF surprised the market, causing ETH price to rise by more than 20%.
-
The net flow of Bitcoin’s U.S. spot ETF turned positive again after four weeks of net outflow, indicating a rebound in TradFi demand.
-
Spending pressures for long-term holders have cooled significantly, and investors have returned to the accumulation model, indicating that volatility is needed to drive the next wave.
Market elasticity enhancement
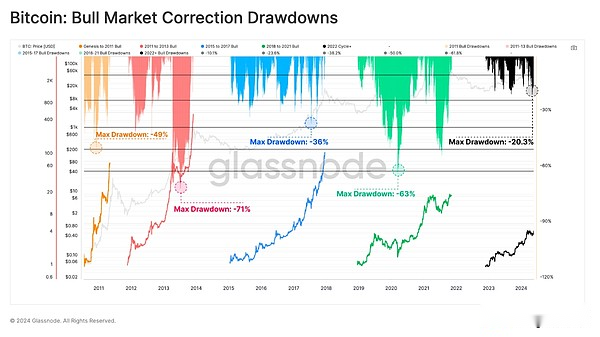
Bitcoin has recovered to ATH after recording its deepest adjustment in closing prices since the FTX low (-20.3%), reaching $71,000 on May 20.From a comparative perspective,The retracement pattern of the upward trend from 2023 to 2024 seems to be very similar to the bull market from 2015 to 2017.
The upward trend from 2015 to 2017 occurred in the infancy of Bitcoin, when there were no derivatives available for the asset class.We can compare with the current market structure, showingThe upward trend from 2023 to 2024 may be mainly spot-driven markets.The launch of U.S. spot ETFs and capital inflows support this view.
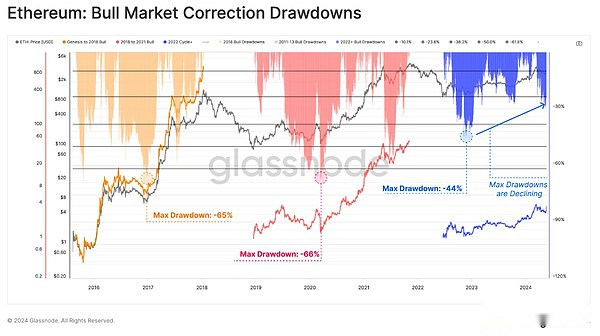
Since the FTX low, Ethereum has also adjusted significantly lighter compared to previous cycles.This structure shows thatBetween each consecutive callback, market elasticity is increasing to a certain extent, while downward volatility is also decreasing.
However, it is worth stressing thatCompared with Bitcoin, Ethereum has recovered slowly.ETH has also performed significantly underperformed in the past two years compared to other leading crypto assets, showing a weaker ETH/BTC ratio.
Nevertheless, this week the United StatesThe approval of the spot Ethereum ETF is a generally unexpected progress that may provide the necessary catalyst to stimulate a stronger ETH/BTC ratio.
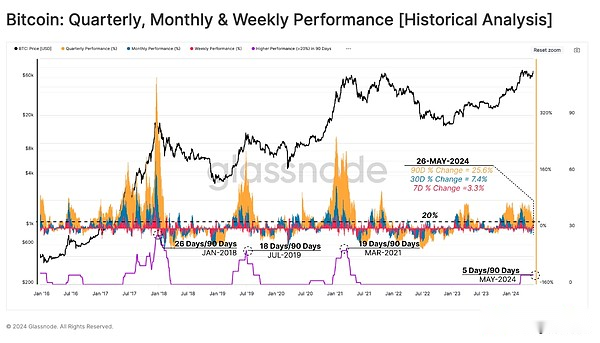
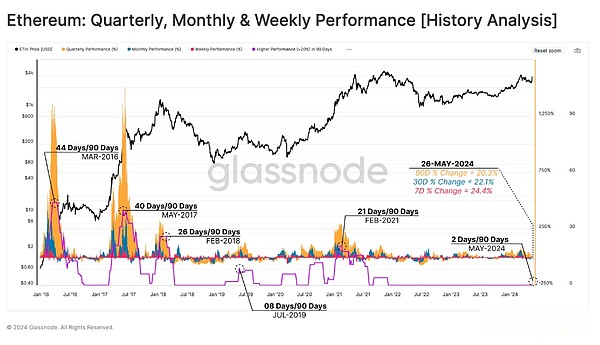
If we examine the rolling performance of the Bitcoin market over the weekly (red), monthly (blue) and quarterly (orange) timeframes, we can see overall strong performance, recording +3.3%, +7.4% and respectively+25.6%.
To highlight periods of particularly strong price performance, we can calculate the number of trading days that all three time ranges within the 90-day window perform more than +20%.So far, this threshold has been reached in only five days last quarter.
In the previous cycle, this number reached 18 to 26 days, which suggestsThe current market may be more cautious compared to the historical bull market.
We can evaluate Ethereum under a similar framework and can see the huge impact of ETF approval.The news almost immediately triggered buyers pressure, with price movements exceeding 20% for the first time since the end of 2021.
If we consider the huge impact of spot ETFs on Bitcoin since the beginning of the year, then the ETH/BTC trading pairs may be showing early signs of a brighter outlook.
ETF buyers make a comeback
In early March, Bitcoin price decisively broke through a new high of $73,000, while long-term holders were selling large supply.This seller has caused oversupply, resulting in a period of adjustment and consolidation.Over time, lower prices and seller fatigue began to give way to the mechanism of re-accumulation.
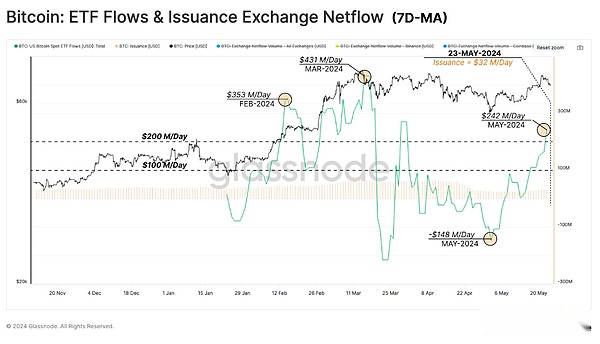
We can see this in Bitcoin ETF traffic, which switched to a net outflow throughout April.As the market sells to a local low of around $57,500, ETFs have seen a massive net outflow of $148 million per day.However, this proved to be a micro-surrender, and the trend has since reversed sharply.
Last week,The ETF experienced a significant net inflow of $242 million per day, indicating a return to buyer demand.Considering the natural selling pressure on miners every day since the $32 million/day halving, the buying pressure on the ETF is almost 8 times that of the original.This highlights the size and scale of the impact of ETFs, but also highlights the relatively small impact of halving.
Back to excitement
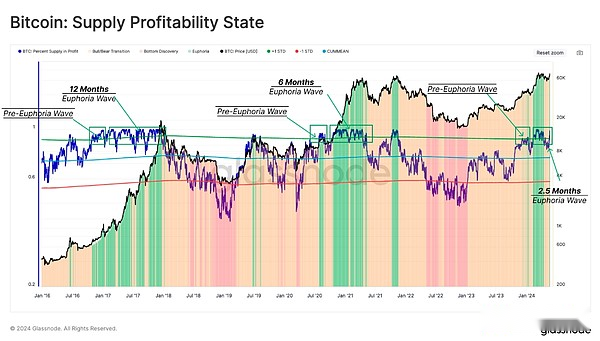
The percentage of circulating supply as profit provides valuable information about each market cycle and a set of repetitive patterns emerges.In the early stages of a bull market, the percentage of supply in profits broke through the statistical threshold of about 90%.This marks the beginning of a pre-exciting phase, which historically attracts investors to profit from the gambling table.
This seller pressure is often attributed to long-term holders who seize the opportunity to exit the market at a high price, especially after enduring downward volatility throughout the bear market.
As the market breaks through new ATH and price discovery, it enters an excitement phase, and over the next 6-12 months, profit supply begins to fluctuate around 90%.The current excitement phase is relatively new, but has been active for about 2.5 months, as of this writing,93.4% of the supply is profitable.
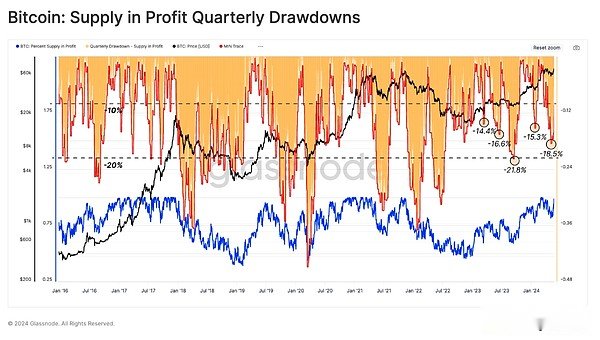
Another tool we can use to monitor corrections is the scale of unrealized losses held by investors.Given that unrealized losses near ATH represent “local top buyers”, we can assess the proportion of supply falling into the 90-day rolling window of loss.The purpose is to evaluate the percentage of tokens that lose their “profitable” status compared to the local price peak.
Mechanically speaking, these deep declines occur when new capital enters the network, absorbing seller pressure distributed during the local uptrend and then falling into losses in the subsequent adjustments.
The depth of the drawdown in the current upward trend is also similar to the bull market in 2015-2017, again indicating that the market is relatively strong.This suggests that despite the local peak, it does not seem to buy too many tokens at an overpriced price.
Buyer pressure vs seller pressure
As prices rise due to new buyer pressure, the importance of rivals from long-term holders (i.e. seller pressure) grows.Therefore, we can measure their motivation for selling by evaluating the unrealized profits of the LTH population and evaluate the actual seller by their realized profits.
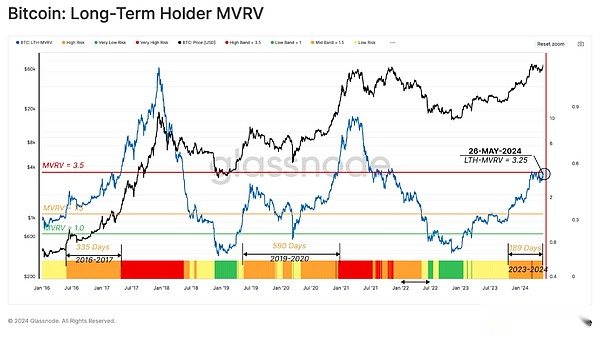
First, LTH’s MVRV ratio reflects its average unrealized profit multiple.Historically, the transition phase between bear and bull markets is LTH trading above 1.5, but below 3.5 (red), and can last for one to two years.
If the market uptrend continues and a new ATH is formed in the process, the unrealized profits held by LTH will expand.This will greatly increase their selling motivation and ultimately lead to a certain degree of seller pressure, gradually exhausting the demand side.
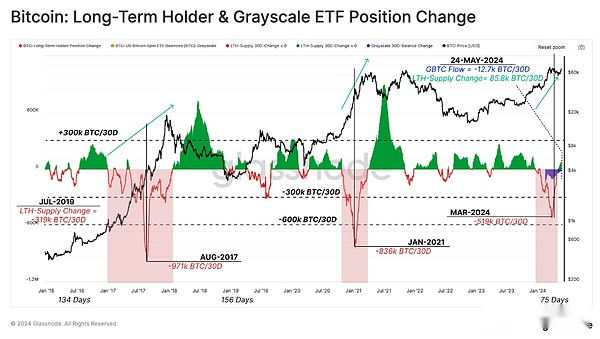
To end this assessment, we will evaluate LTH’s spending rate through a 30-day net position change in LTH supply.During the preparation phase of ATH in March, the market went through the first major LTH allocations.
In the past two bull markets, LTH’s net distribution ratio reached 836,000 to 971,000 BTC/month.Currently, net selling pressure peaked at 519,000 BTC/month in late March, with approximately 20% of which comes from Grayscale ETF holders.
This high spending state is followed by a cooling-off period, with the local accumulation state leading to a monthly increase of approximately +12,000 BTC for the total LTH supply.
Summarize
Seller pressure has been significantly reduced after long-term investors invested heavily in $73,000 ATH.Since then, long-term holders have begun re-accumulating Bitcoin for the first time since December 2023.In addition, demand for spot Bitcoin ETFs has also rebounded significantly, with positive capital inflows reflecting huge buyer pressure.
Additionally, the competitive environment between Bitcoin and Ethereum has become fair as the SEC approves the U.S. spot ETF.This further consolidates the growing adoption of digital assets throughout the traditional financial system and is an important step forward for the industry.