
Author: CryptoVizArt, UkuriaOC, Glassnode; Compilation: Baishui, Bitchain Vision
summary
-
After several months of relatively heavy distribution pressure, Bitcoin holders’ behavior appears to be turning to holding and accumulating.
-
Activity in the spot market shows that seller pressure has increased significantly recently and that trend has not completely subsided.
-
Compared with the ATH breakthrough in the past cycle, the long-term holder group currently holds a relatively large proportion of online wealth.
-
Overall, on-chain conditions show that Bitcoin holders are full of confidence.
Big wallet returns to cryptocurrency holding model
As the market begins to recover slowly from last week’s sell-off, there is obvious uncertainty and indecision among digital asset investors.However, a tendency to hold began to emerge when analyzing investors’ on-chain reactions to these volatile market conditions.
Since the Bitcoin price hit an all-time high in March, the market has experienced a wide supply allocation period, with wallets of all sizes participating.This trend has shown early signs of a reversal over the past few weeks, especially for the largest wallets that are typically associated with ETFs.These big wallets seem to be returning to the accumulation model.
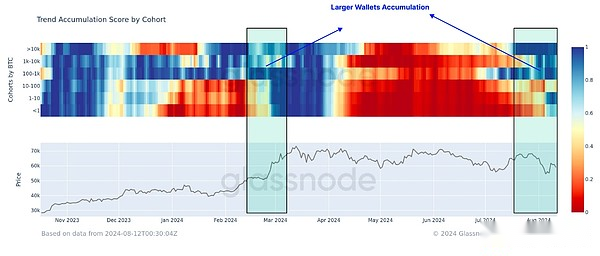
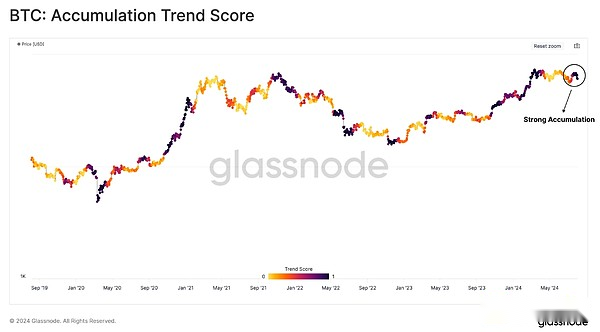
The cumulative trend score (ATS) indicator evaluates the weighted equilibrium changes throughout the market.The indicator also shows thatThe market is shifting to cumulative dominant behavior.
The above-mentioned shift to accumulation prompted ATS to record its highest possible value of 1.0, indicating significant market accumulation over the past month.
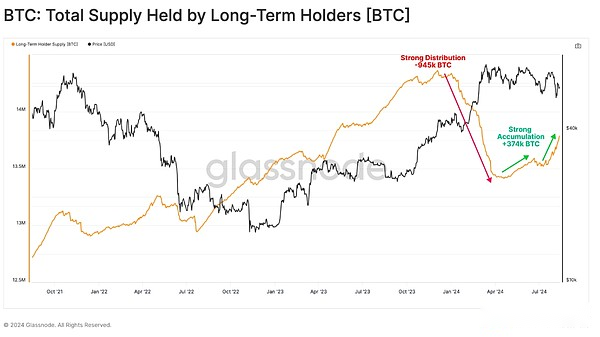
This observation is consistent with long-term holders (LTH), who ditched heavily before hitting record highs.This group has now regained their preference for HODLing, with a total of +374k BTC transferred to LTH status in the past 3 months.
From this, we can infer thatThe investor’s tendency to hold tokens has now become a greater force relative to their spending pressure.
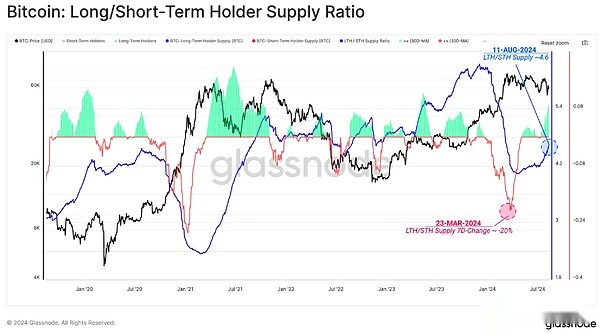
We can also evaluate the 7-day change in LTH supply as a tool to evaluate its total balance change rate.
We can see that the LTH distribution is significant, which is a typical feature of the formation of the macroscopic top, entering March ATH.More distribution pressure was recorded in less than 1.7% of trading days.Recently, this indicator has been restored to the positive area, indicating thatThe LTH community expresses preference for holding its tokens.
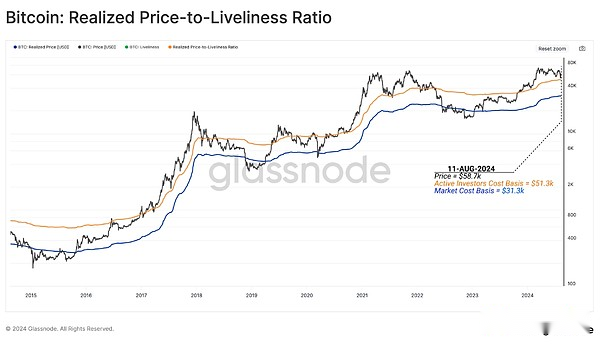
Although spot prices have been higher than the active investor cost base from April to July, which represents the average acquisition price of active tokens in the market.
The cost base of active investors can be seen as a key threshold for dividing bullish and bearish investor sentiment.As the market manages to find support near this level, this indicates a certain level of potential strength in the market, indicating that investors generally still expect the market to show positive momentum in the short- to medium-term market.
Assess the deviations in the spot market
When the market is in a technical downward trend, we can use the CVD indicator to estimate the current net balance between buying and selling pressures in the spot market.
This indicator can in turn be used to assess the medium-term market momentum, as well as any headwinds or tailwinds of prices.Since the formation of the new ATH, we have noticed a persistent mechanism of net seller pressure.
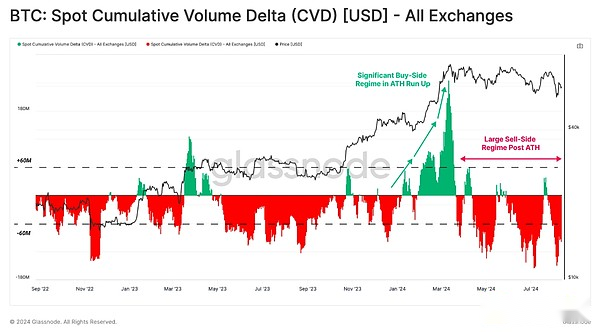
A positive CVD value indicates a net buyer pressure, while a negative value indicates a net seller pressure.
When we analyze the annual median of spot CVD, we can see that the medians in the past 2 years have fluctuated between -22 million and -50 million, indicating a net seller bias.
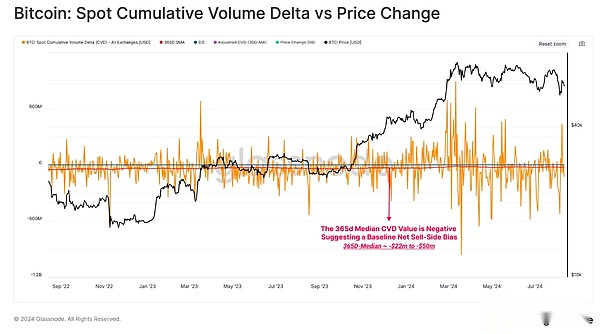
If we consider this long-standing median as the baseline of CVD equilibrium, we can generate an adjusted metric variable to consider and correct this implicit seller bias.
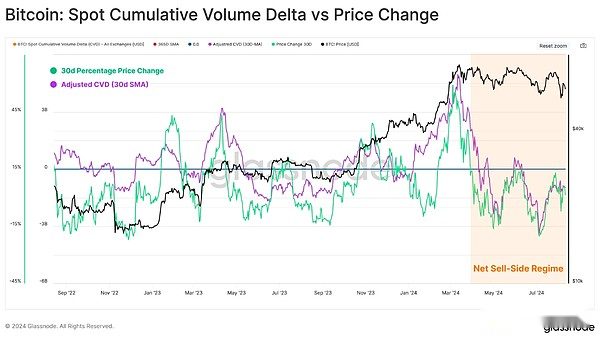
An interesting fusion can be found when comparing the adjusted spot CVD (30d SMA) with monthly percentage price changes.
In this framework, part of the recent failure to break through the $70,000 region can be attributed to weak spot demand (negatively adjusted CVD).Alternatively, a potential recovery in spot market demand can be confirmed when the adjustment CVD indicator returns to positive values.
Periodic fluctuations
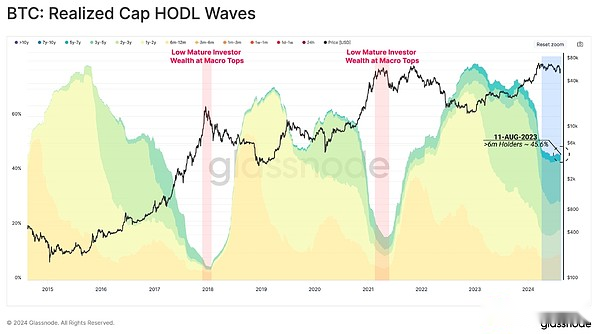
Price fluctuations in recent months have led to a significant slowdown in the distribution pressure of LTH.This causes the percentage of online wealth held by this group to stabilize first and then start to grow again.
Despite the huge sell-side pressure on the market ATH, long-term investors’ wealth held by long-term investors remains at all-time highs compared to previous all-time highs.
This suggests that if BTC prices rise in the future, LTH may face further pressure on divestment.This also shows that despite the recent sideways and even declines in price, these investors are increasingly reluctant to sell their tokens at lower prices.
Despite fluctuations in market conditions, both observations suggest thatThe holder group is more patient and tough.
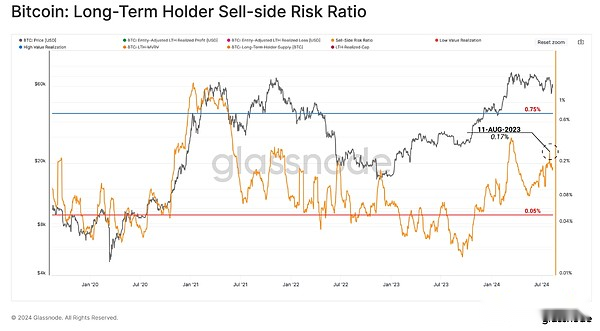
Finally, we can use the LTH seller risk ratio to support this assessment.This tool measures the absolute sum of realized profits and losses locked by investors, relative to asset size (realized market capitalization).We can consider this indicator under the following framework:
-
A high value means that when an investor spends tokens, he or she has a large profit or loss relative to his or her cost basis.This situation suggests that the market may need to re-find a balance and will usually occur when prices fluctuate greatly.
-
A low value indicates that most tokens spend relatively close to their break-even cost basis, indicating that a certain level of balance has been reached.This situation usually indicates that the “profit and loss” in the current price range has been exhausted, and usually describes a low volatility environment.
Compared to previous ATH breakouts, the LTH seller risk ratio is still at a low level.This meansThe profit margins obtained by the LTH group are relatively small compared to previous market cycles.This also means that the group is waiting for higher prices before increasing its distribution pressure.
Summarize
Despite the challenging and turbulent market environment,Long-term Bitcoin holders remain unwavering, with evidence that they are stepping up their share price increase.
Compared to the highest levels in previous cycles, this group of investors held a higher proportion of Bitcoin network wealth, which shows thatInvestors show a certain degree of patience and wait for higher prices.also,With the biggest contraction in the cycle, the group of investors did not experience panic selling, highlighting the resilience of their overall beliefs.