Author: UkuriaOC, CryptoVizArt, Glassnode; Compilation: Baishui, Bitchain Vision
summary
-
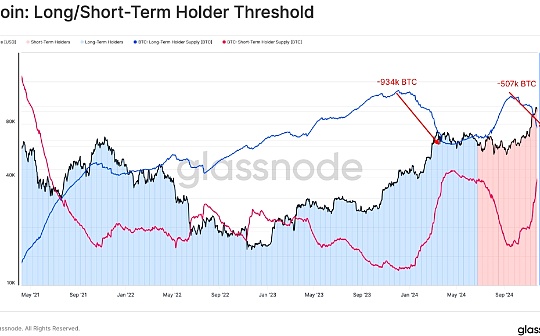
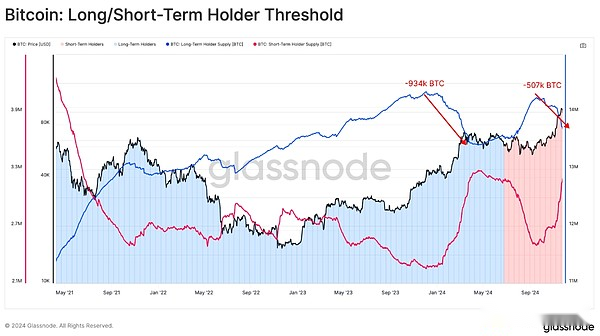
As the price of Bitcoin rose to $100,000, long-term holders began distributing more than 507,000 BTC, which is still important, although still below the seller’s 934,000 BTC during the March rise.
-
Long-term holders locked in a substantial amount of profits, setting daily profits to a new high of $2.02 billion.
-
When evaluating the composition of entity spending, the majority of seller pressure appears to come from tokens between 6 months and 1 year.
Long-term holders sell intensified
After a series of ongoing new ATHs, the price of Bitcoin is now close to the impressive and long-awaited $100,000 per coin.As with all previous cycles, the long-term group of holders is taking advantage of liquidity inflows and increased demand side to restart the massive sale of held supplies.
The group has now sold 507,000 BTC since LTH supply peaked in September.This is a considerable scale; however, it is smaller than the 934,000 BTC during the ATH rebound in March 2024.
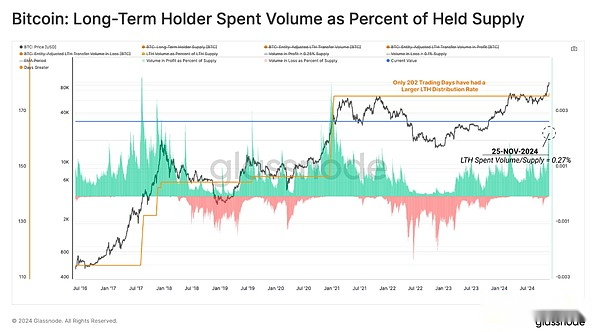
We see a similar situation by evaluating the percentage of the total supply of long-term holders traded from profitable positions.Currently, the average LTH supply is sold per day is 0.27%, with only 177 trading days of all trading days with a higher sales rate.
Interestingly, we can observe that the relative ratio of LTH spending is higher than that of ATH in March 2024, highlighting more active sales activity.
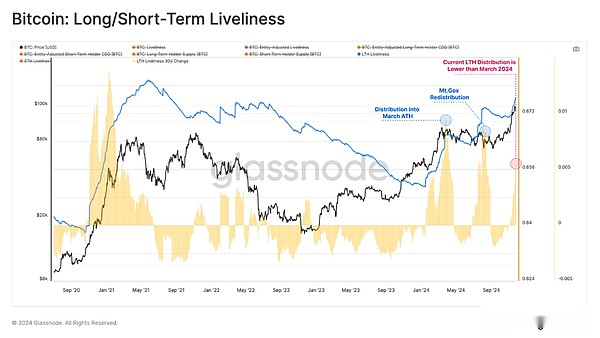
We can also refer to the LTH vitality indicator to evaluate the balance between Coinday creation (holding time) and Coinday destruction (holding time spent).Generally, the upward trend of vitality is characterized by an environment where consumption activity increases, while the downward trend indicates that long-term holding is the main driving force.
While the current supply allocation rate is greater than the peak in March, Coinday’s destruction remains low.This highlights that most LTH token transactions may have been recently acquired (e.g., more likely to be 6 months on average than 5 years).
Profit lock
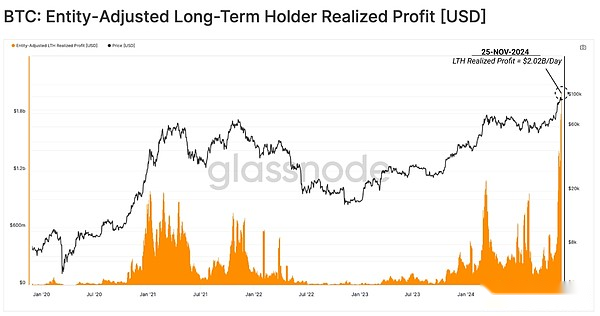
Long-term holders play a key role in the price discovery process, as they are the primary source of previously dormant supply return to liquidity circulation.As the bull market progresses, it becomes more cautious to assess the extent of profit-taking for this group, as they tend to become more active as prices rise.
Long-term holders currently realize a profit of up to $2.02 billion per day, setting a new ATH, surpassing the new ATH set in March.A strong demand side is needed to fully digest this oversupply, which may take some time to re-accumulate before it can be fully digested.
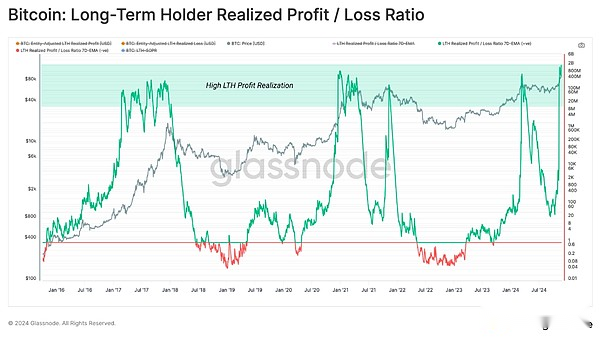
Assessing the balance between profit and loss of LTH, we can see that the ratio of the two accelerates rapidly in November.By definition, this is due to the loss of LTH supply during this price discovery mechanism.
Historically, assuming there is a large and continuous inflow of new demand, prices will remain optimistic for several months.
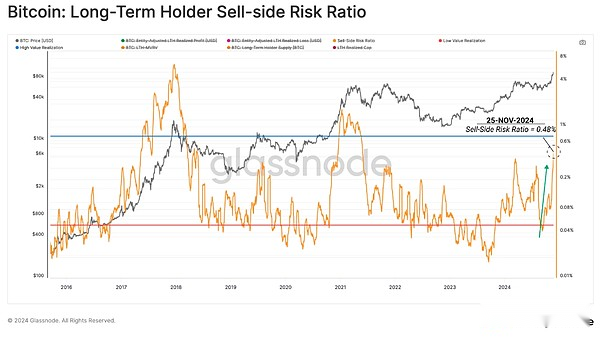
Seller risk ratio assesses the total amount of realized profits and losses locked by investors relative to asset size (measured by realized caps).We can consider this indicator under the following framework:
-
High valueIndicates that investors spend tokens on profits or losses comparable to their cost basis.This situation suggests that the market may need to re-find a balance and that there are often high volatility in price movements.
-
Low valueIt shows that most tokens spend relatively close to their break-even cost basis, indicating that some level of equilibrium has been reached.This situation usually means that the “profit and loss” in the current price range has been exhausted and often describes a low volatility environment.
The seller’s risk ratio is approaching the high value range, and it is inferred that a significant profit settlement is occurring within the current range.Nevertheless, the current reading is still significantly lower than the final value reached in previous cycles.This shows that even under similar relative selling pressures, there was enough demand in the previous bull market to absorb supply.
Selling composition
After determining that long-term holders profit-taking has increased significantly, we can increase the granularity of the assessment by carefully reviewing the composition of the supply sold.
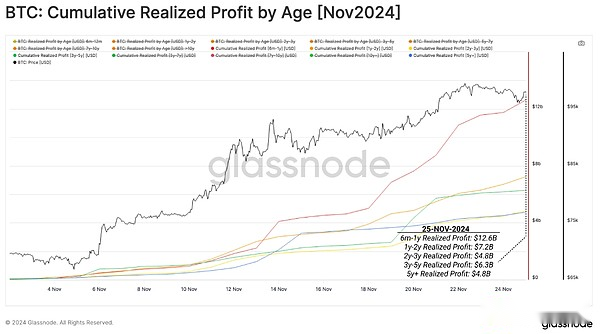
We can use the age breakdown of the realized profit metrics to evaluate which subgroups contribute the most to seller pressure.Here, we calculate the cumulative profit settlements since November 2024 on a time basis.
-
Profits realized in 6 months to 1 year: US$12.6 billion
-
Profits realized in 1-2 years: US$7.2 billion
-
Profits realized in 2-3 years: US$4.8 billion
-
Profits realized in 3-5 years: US$6.3 billion
-
Profits realized in more than 5 years: US$4.8 billion
Tokens, which last between 6 months and 1 year, dominate the current seller pressure, accounting for 35.3% of the total.
The tokens, which last from 6 months to 1 year, dominate, highlights that most of the spending comes from recently purchased tokens, highlighting that more long-term investors remain cautious and may be patient with a higher price.One might say that these sell-offs may describe investors in volatile trading styles who have accumulated funds after the launch of the ETF and plan to take advantage of the next wave of markets.
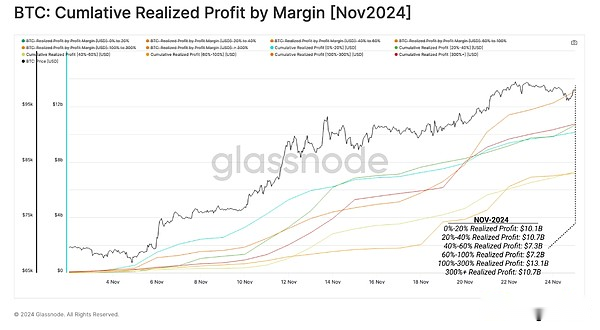
Next, we can apply the same approach to the profit size achieved by all investors and classify it by locked ROI percentage.
-
0%-20% profit: US$10.1 billion
-
20%-40% profit: US$10.7 billion
-
40%-60% profit: US$7.3 billion
-
60%-100% profit: US$7.2 billion
-
100%-300% profit: US$13.1 billion
-
300%+Realized profit: US$10.7 billion
Interestingly, there is a certain degree of consistency among these groups, with all groups accounting for a similar proportion of the total.It can be said that this represents an “unrealistic” strategy, i.e.Investors with lower cost base make similar dollar profits by selling fewer tokens over time.
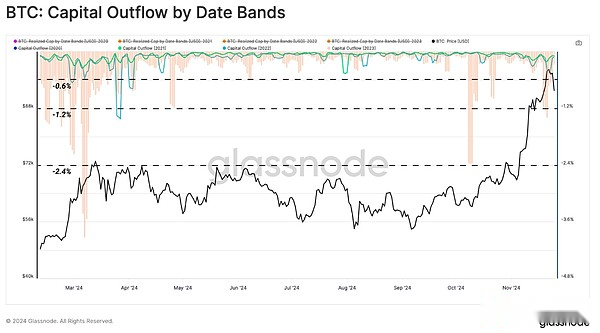
With particular attention to tokens purchased during 2021, 2022 and 2023, we can observe a large and continuous spending behavior during the peak in March.
However, in the current rally, selling behavior mainly includes tokens purchased in 2023, while tokens purchased in 2021 and 2022 only began to increase their seller pressure.This is again consistent with the possible explanation of “swing trading” profit-taking as the dominant strategy.
Measuring sustainability
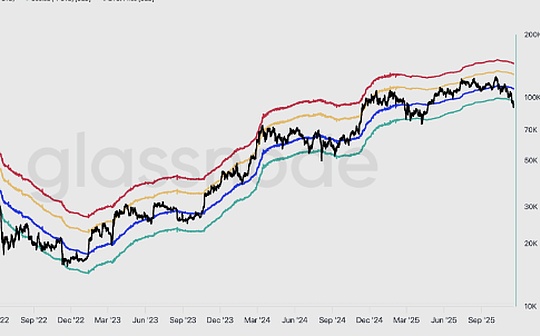
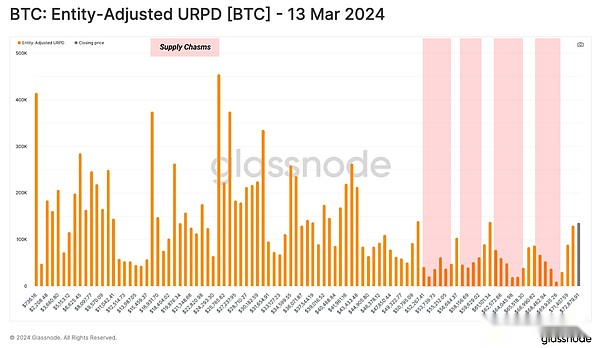
To measure the sustainability of this uptrend, we can compare the structure of the current URPD with the structure experienced during the March 2024 ATH.
In March 2024, supply from several supply clusters changed hands between $40,000 and $73,000 after a few months of appreciation after the ETF’s launch.During the subsequent seven months of price fluctuations, the region became one of the most important supply clusters in history.
As supply accumulates again, it forms the final support for the start of this rebound.
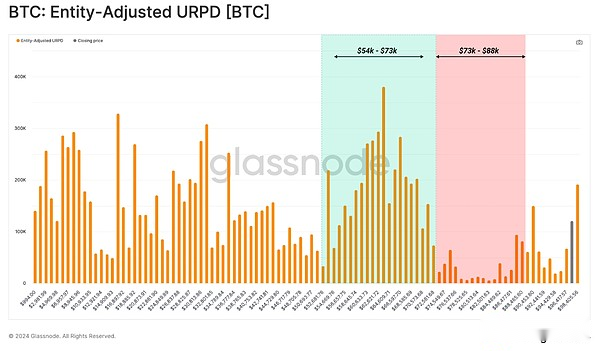
Fast forward to today, the market rebounds so quickly that few BTCs have moved between $76,000 and $88,000.From this we can determine two key observations:
-
Price discovery is a process that often requires rebound, correction and consolidation to confirm new price ranges.
-
There is some kind of “air gap” below $88,000, which could become a focus area if the market pulls back lower before retrying to break $100,000.
Changes in supply distribution can provide insight into the supply and demand regions of interest when the market tries to re-find a balance in this price discovery mechanism.
Summarize
Long-term holders are selling backed by rising prices.This creates an oversupply, and supply must be absorbed to accommodate the continued price increase.
When evaluating the composition of entity spending, the majority of seller pressure appears to come from BTC between 6 months and 1 year.This highlights the potential for further selling of old entities that require higher prices to sell their BTC.