Source: Coinbase; Compilation: Five baht, Bitchain Vision
summary
-
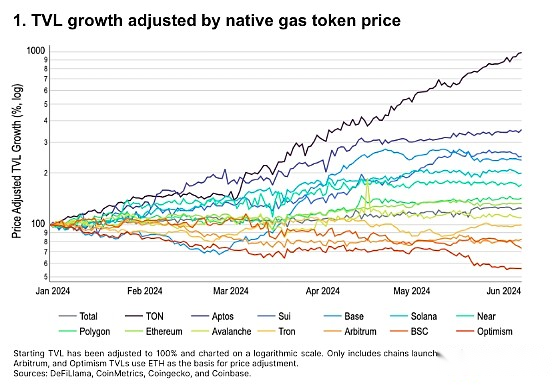
We observed the growth of the total lock value (TVL), which was appreciated by the price appreciation of the primary GAS tokens in the L1 and L2 networks.
-
We analyzed the impact of CME futures basic transactions on ETF traffic. The results showed that since the beginning of April, the growth of non -pads BTC ETF has slowed significantly.
Foreword
Through 10 charts, this article reviews the basic trends and technical trends of the encryption market in the first half of 2024.We have studied the growth of total lock value (TVL), which is appreciated by the price appreciation of the primary GAS tokens in the L1 and L2 networks.We also adopt relative methods to measure the activities on these network chains through the general transaction fee and active address, and then analyze the biggest driving factor of the transaction fee on Ethereum on the Ethereum.After that, we studied the current situation of supply dynamics, correlation, and the current market liquidity of cryptocurrencies.
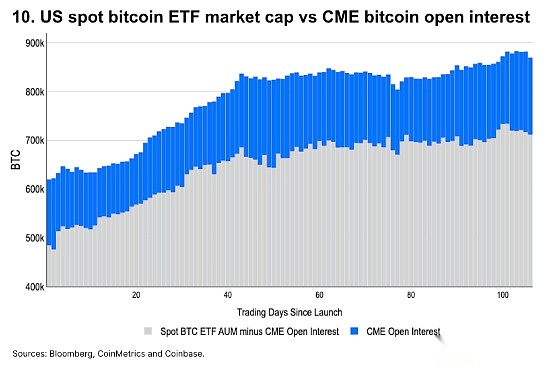
In addition, one of the more closely tracked indicators in cryptocurrencies is the inflow and outflow of the American spot Bitcoin ETF, which is usually regarded as a representative of the changes in the demand for cryptocurrencies.However, the growth of the Chicago Commodity Exchange Bitcoin Futures Line Contract (OI) has shown that since its launch, the inflow of ETF has been driven by basic transactions.We analyzed the influence of the Chicago Commodity Exchange (CME) futures basic transactions, showing that since the beginning of April, the growth of non -BTC ETF exposure has slowed significantly.
Fundamental
TVL growth
We will not compare the original TVL of different chains, but follow the standardized TVL growth of the appreciation of the price appreciation of its native GAS token.Generally, due to the mortgage or liquidity, the native token constitutes a large part of TVL in the ecosystem.Adjusting the growth of TVL through price growth helps to separate how many new value creations in TVL growth rather than pure price appreciation.
Overall,So far this year, TVL’s growth has exceeded the total market value of cryptocurrencies by 24%.The fastest -growing chain -TON, APTOS, SUI, and Base can be considered relatively new and benefit from the rapid growth stage.
Fees and users
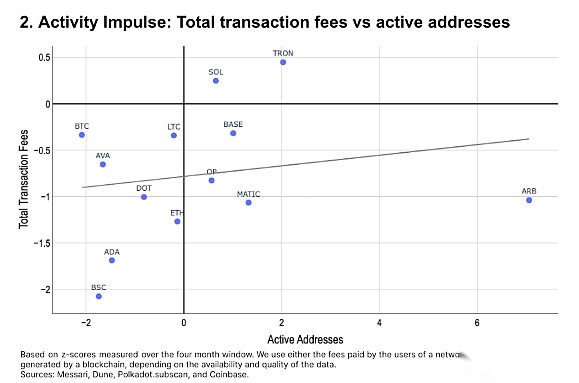
We compare the average daily active address of each network (1) in May with the average daily fee or income of the same period of the same period. Both are compared with the first four months (January to April)Standard deviation to measure.The results show:
-
Except for Solana and TRON, the cost of the chain in May generally declined;
-
With the decline in the cost of EIP-4844, the active address on the Ethereum L2 (especially Arbitrum) increased significantly;
-
The cost of Cardano and the Binance Intelligent Chain is lower than the decline in wallet activities.
Trading cost driving factor
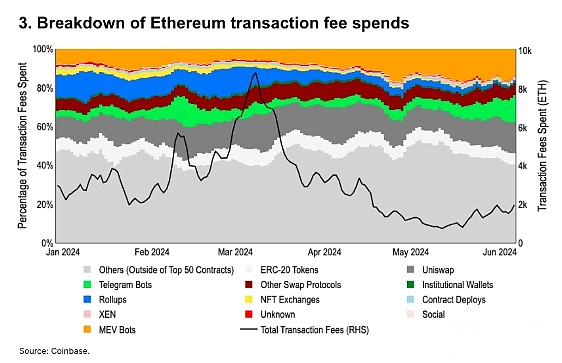
Classification of the expenses of the top 50 contracts on Ethereum.TheseThe contract accounts for more than 55% of the total GAS expenditure since the beginning of the year.
After the DENCUN upgrade in March, Rollup’s expenditure has gradually decreased from 12% of the main network fee to & lt; 1%.MEV (maximum extraction value) drive activities have increased from 8% of the transaction fee to 14%, and direct transaction costs have increased from 20% to 36%.Although ETH has developed inflation since mid -April, we believe that the return of market fluctuations (and high -value trading block demand) may offset this trend.
Ethereum L2 growth
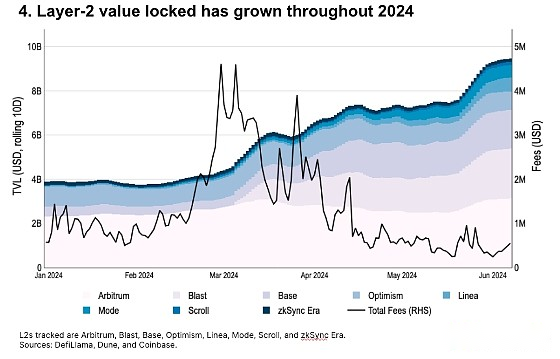
The Ethereum L2’s TVL has increased by 2.4 times since the beginning of the year, and as of the end of May, the total TVL of L2 was $ 9.4 billion.As of early June, Base currently accounts for about 19%of L2 total TVL, second only to Arbitrum (33%) and BLAST (24%).
At the same time, although TVL (and the number of transactions on many chains) is at the highest level in history, since the launch of BLOB storage in Dencun upgrade on March 13, the total transaction costs have fallen sharply.
Bitcoin active supply changes
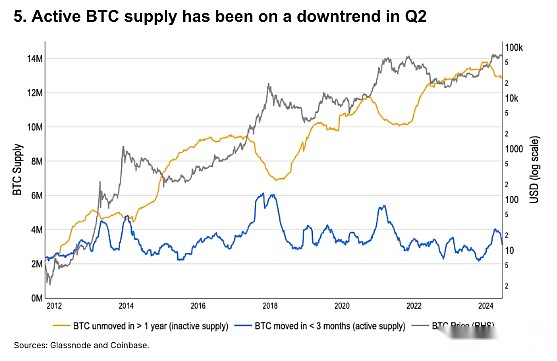
Active BTC supply (we define it as a BTC that has moved in the past three months). The decline in the local price is at the historically peak of the local price, indicating thatThe market turnover slows down.The active BTC supply reached the local peak of 4 million BTC in early April -this is the highest level since the first half of 2021 -then dropped to 3.1 million BTC in early June.
But at the same time, the non -active supply of BTCs (that is, not moving more BTCs in the past one year) has remained stable this year.We believe that this shows that the short -term market excitement has gradually faded, although long -term cyclical investors still pay attention.
Technical
Correlation
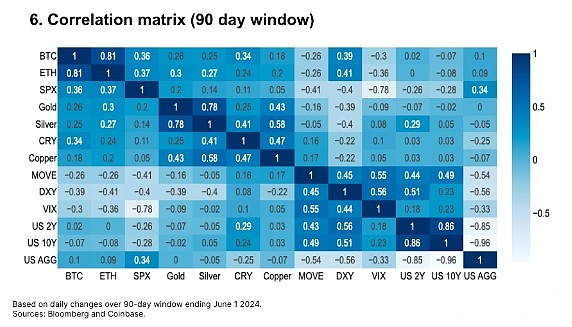
Based on a 90 -day time window,The return of Bitcoin seems to be medium to daily changes in some key macroeconomic factors.These include US stocks, commodities and multilateral dollars, although the positive correlation with gold is still relatively weak.
at the same time,The correlation between Ethereum and Standard Purcera 500 Index (0.37) and Bitcoin and Bitcoin and Standard Purcell 500 Index (0.36) are almost the same.Compared with cross -industry, the transaction correlation between cryptocurrencies is still very high, although the correlation between BTC/ETH has dropped slightly from March to April 0.85 to 0.81.
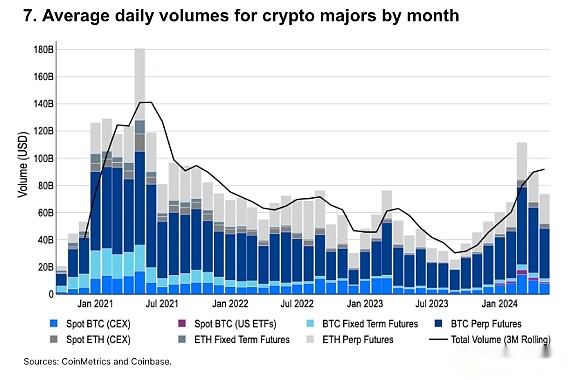
Increase market liquidity
The average daily trading volume of the spot and futures of BTC and ETH decreased by 34%compared with the $ 111.5 billion in March 2024.Nevertheless, the transaction volume ($ 74.6 billion) in May is still higher than every month since September 2022, except for March 2023.
After the US spot Bitcoin ETF was approved in January, the trading volume of spot Bitcoin also rebounded significantly. In MayEssenceIn May, the spot Bitcoin ETF trading volume was 1.2 billion US dollars, accounting for 14%of global spot trading volume.
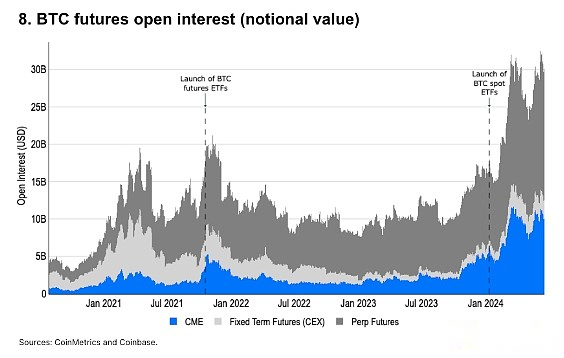
CME Bitcoin Futures
Since the beginning of 2024, CME OI has increased by 2.2 times (from $ 4.5 billion to $ 9.7 billion)It has increased by 8.1 times since the beginning of 2023 ($ 1.2 billion).We believe that so far this yearMost of the new traffic can be attributed to the base difference transaction after the spot ETF is approved.After launch, the Bitcoin Bidae transaction can now be fully carried out in the United States with traditional securities brokers.
PERPS OI also increased from US $ 9.8 billion to 16.6 billion US dollars so far this year, which kept the proportion of CME OI at about 30%(29-32%) throughout the year.Saying,,The market share of CME futures has increased significantly from 16% in early 2023, indicatingInterests of institutions in the United States have increasedEssence
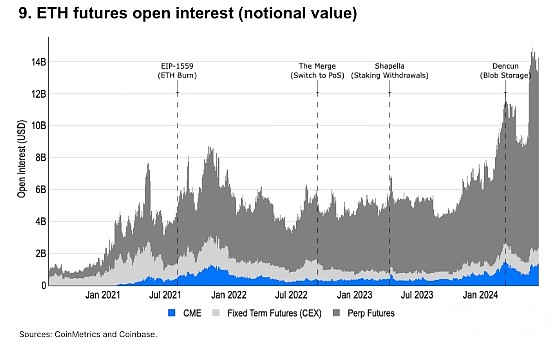
CME Ethereum Futures
CME ETH Futures OI is close to the highest level in history.However, ETH OI is still dominated by sustainable futures contracts, which are only available in certain non -US judicial jurisdictions.As of June 1, the total OI’s 85%($ 12.1 billion) came from a sustainable contract, while CME futures accounted for only 8%($ 1.1 billion).
The impact of endogenous ETH catalysts on OI is usually obvious. The last time OI soared sharply after the United States approved the spot ETH ETF (19B-4 filing).Prior to this, OI reached its peak at DENCUN upgrade on March 13.
in addition,The traditional fixed term futures of the centralized exchange are still very popular, and the number of OI is similar to CME futures.
Isolation CME Bitcoin Base Differential Transaction
Standardizing the total market value of the spot ETF with CME Bitcoin OI indicates that most of the spot ETF traffic since the beginning of April (55th) can attribute to the basis trading.
After the spot ETF was approved, as of March 13 (43rd), the number of BTCs hosted by ETF increased by about 200,000 BTC.This shows that the BTC has a targeted buy during this period, which explains the reason for the rise in prices to a certain extent.Since then, the number of BTCs hosted by ETF has been fluctuating between 82.5-85 million, and it was not until the end of May that the interval did not break through the interval.