Author: Filippo Pozzi Source: Medium Translation: Shan Oba, Bitchain Vision Realm
The goal of this article: Get the complete and detailed pictures of the “health” state of the “health” state in the main blockchain ecosystem
method: Analyze the data as usual.Especially we will see:
-
Total lock value (tvl)
-
The total lock value divided by the blockchain
-
Number of transactions
-
The most useful protocol
-
Stable currency market value
Total lock value (tvl)
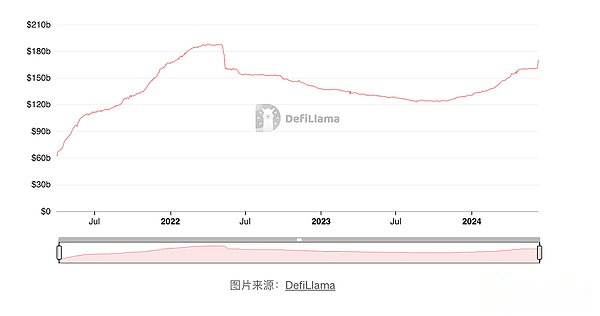
The first indicator of our analysis is the total lock value (TVL), which is one of the most important indicators in the field.
Before continuing, it is important to reflect on why analyzing this indicator is very important.TVL said that the total value of cryptocurrencies locked or frozen in the DEFI protocol through smart contracts is used for various purposes, such as cryptocurrency transactions, lending, liquidity mining, pledge and other counter -central financial activities.
High TVL shows that the services provided by DEFI are widely used and people have a strong interest in operating in the DEFI ecosystem; on the contrary, low TVL indicates that they are more interested in this decentralized financial solution.
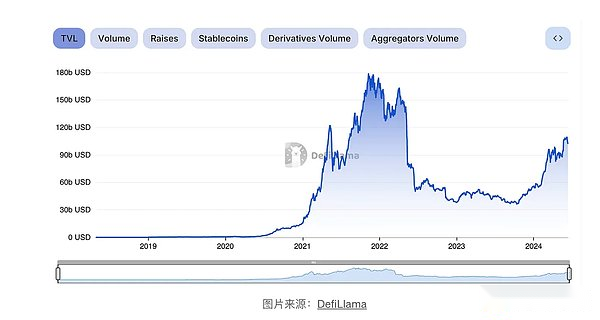
From the above figure, it can be clearly seen that the overall TVL in all blockchain showed index growth during 2021, and then fell, from a peak of US $ 180 billion to about $ 30 billion.However, in the past year, we have seen a new period of growth, and currently TVL is about $ 100 billion.
Consistent with the general trend of cryptocurrencies, TVL has experienced a strong term from mid -2022 to the end of 2023.This part is due to the failure of the famous Terraluna protocol and the subsequent bear market.Nevertheless, the chart shows a very positive prospect for next year, showing the significant growth of TVL recently.This growth is due to the user’s new trust in DEFI products.
The total lock value divided by the blockchain
Continue to analyze TVL, let us pay attention to the location of these value storage.Until a few years ago, almost 100% tvl was on Ethereum.However, over time, the situation has changed.Although Ethereum is still the largest blockchain, an ecosystem that replaces blockchain has played an important role in the industry.
What needs to be clarified is that it is incorrect to refer to all existing blockchains as “alternative blockchain” (relative to Ethereum).In fact, the second -level network of Ethereum, although it is an independent blockchain, shared most technologies with Ethereum.Therefore, these are considered to be an expansion of Ethereum, not alternatives.
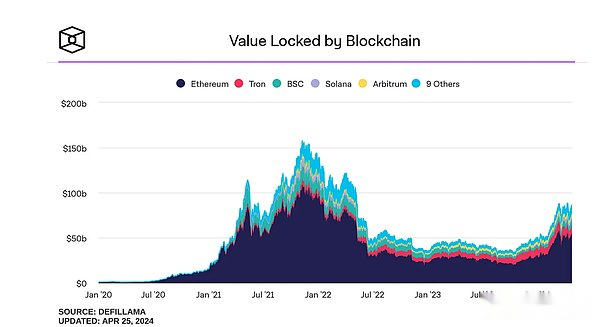
As mentioned earlier, Ethereum is still the most important participant in DEFI, and currently holds more than 60% of the total TVL.Followed by TRON, it accounts for more than 8%. It is the reference blockchain that creates the most commonly used stable currency USDT.Next is BSC, accounting for 5.19%, which is one of the oldest blockchain in this field. Its importance in DEFI has decreased slightly. More advanced networks such as Solana and Arbitrum accounted for 4.37% and 2.95, respectively.%.
After the Dencun update, this is my article link, explaining the importance of this update in the Ethereum ecosystem and its second layer.As I hope (we are guessing the field), the activities on the main layer 2 are gradually increasing, because its operations have unparalleled convenience and speed compared to the Ethereum blockchain.
Number of transactions
Although I first analyzed TVL in this article, I think this indicator is extremely important, but I don’t think it is the indicator that can best indicate the health of the ecosystem.In fact, TVL is directly affected by the capital value of locking in smart contracts.
Assuming that during a bear market (similar to the situation between 2022 and 2023), no user extracts capital from the DEFI agreement.However, the depreciation of underlying assets will still lead to a decline in TVL, giving people an error impression that capital flows out of the ecosystem.
This is why we are now turning to the number of transactions that occur in the DEFI protocol, because we believe it will tell us a story different from TVL charts.
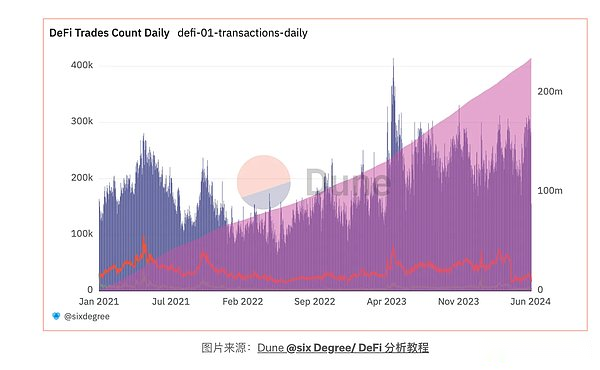
Looking at this chart, we can notice that a situation that is highlighted in TVL analysis is significantly different.Although the transaction volume decreased after the summer of 2021, this decline cannot be compared with the decline in TVL records.In addition, it is important to pay attention to the number of transactions in the summer of 2021 to reach the peak and decline in 2022. It has greatly exceeded the peak of 2021 in April 2023, and continues to record the number of peaks higher than 2021, which shows that it shows the indication, which indicates the indication, which indicates that it indicates that it indicates that it shows the indication, which indicates that it indicates that it indicates that it indicates that it indicates that it shows the indication, which indicates that it shows the indication, which indicates that it shows the indication, which indicates that it shows the indication, which indicates that it indicates that it indicates that it indicates that it indicates that it indicates that it shows the indication, which indicates that it indicates that it indicates that it indicates that it indicates that it shows the indication, which indicates that it indicates that it indicates that it shows the indication, which indicates that it indicates that it indicates that it indicates that it shows the indication.Increasing interest in the DEFI field and increasing activities in these protocols.
The most useful protocol
Now let’s analyze the previous charts from another angle to pay attention to the source of the transaction to identify the most related protocols in the DEFI.
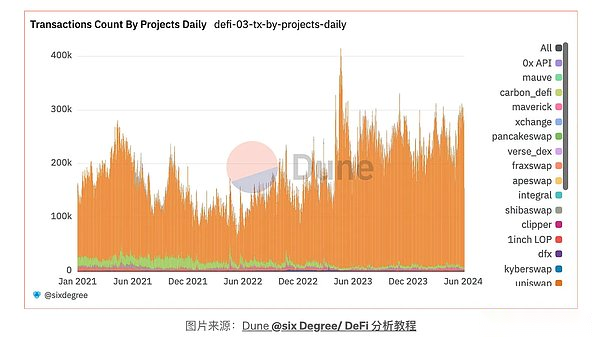 From my perspective, the results revealed by this chart are very surprising.Before starting this study, I think Uniswap (represented by orange candles) is one of the most related agreements in the field.However, the result made me dazzling, indicating that since it has come in 2021, Uniswap represents most of Defi transactions, followed by Sushiswap and Curve.
Although surprised by this chart, it must be pointed out that the chart represents the number of transactions, not the transaction volume/USD for protocol transfer.
Stable currency market value
The last indicator of our analysis involves the number of stable coins in DEFI.
But why is it important to consider the number of stable coins in the ecosystem?The reason is simple, stable currency = liquidity, liquidity = potential future investment.In fact, stablecoin represents the available liquidity in this field, indicating the investment ability of the holder.Increased liquidity leads to new investment.
 As we see, this chart is consistent with other chart observation, and it has decreased during 2022 to 2023.However, this reduction is the minimum, and subsequent recovery in 2024 has emerged, and has increased slightly in recent weeks.This has reached the level of 190 billion US dollars recorded in the summer of 2022.