
Author: UkuriaOC, CryptoVizArt, Glassnode; Compiled by: Deng Tong, Bitchain Vision
-
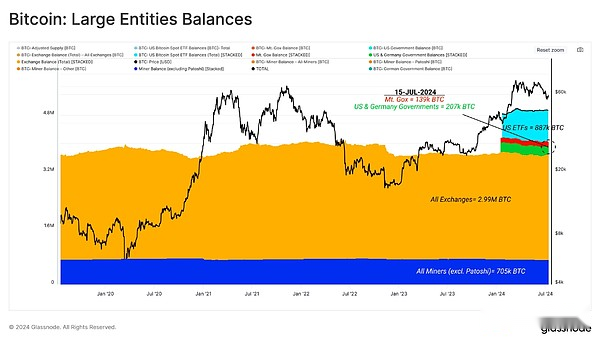
Large entities currently hold approximately 4.9 million BTC, equivalent to 25% of the circulating supply.Among these entities, centralized exchanges and ETF custodians account for the largest proportion.
-
After the German government completely exhausted the BTC seller market, the seller market seemed to be alleviated in the short term, while demand has also flowed back in to support the market.
-
Market profitability remains very strong, with most of the token supply still remaining on a favorable cost basis, below the current spot price.
Evaluate large entities
The pattern of Bitcoin holders is constantly evolving, which requires the analysis framework to evolve over time.Historically, miners and exchanges have been the largest and most important Bitcoin holders.
Throughout history, a large number of tokens have been ultimately kept by market-neutral entities, such as the Mt.Gox trustee, whose mission is to keep tokens recovered after the collapse and bankruptcy of the Mt.Gox exchange.Similarly, government law enforcement has seized a large number of tokens and sold them regularly in batches.
Recently, institutional-level trustees and ETFs have also entered the market.11 new US spot ETFs have now accumulated +887K BTC, making their total balance the second largest Bitcoin pool we monitor.
The following figure shows the amount of BTC these large entities hold.
-
Centralized exchange: 3 million BTC(yellow)
-
US ETF Balance: 887,000 BTC(grey)
-
Miners including Patoshi: 705,000 BTC(blue)
-
Government Entity: 207,000 BTC(green)
-
Mt Gox Trustee: 139,000 BTC(red)
Miners have historically been the main source of seller pressure, but their supply correlation does decline with each halving event.Net miner flows over the past 12 months show that the total balance changes per week are typically about ±500 BTC.
In the following figure, we willNet miner flow (blue)andNet deposits/withdrawals in centralized exchanges (red)as well asNet traffic to the ETF on-chain wallet (green)Make a comparison.We can see that the latter two entities usually experience larger ±4K BTC fluctuations, which indicates thatThese entities may have a traffic of 4 to 8 times greater than miners’ market influence.

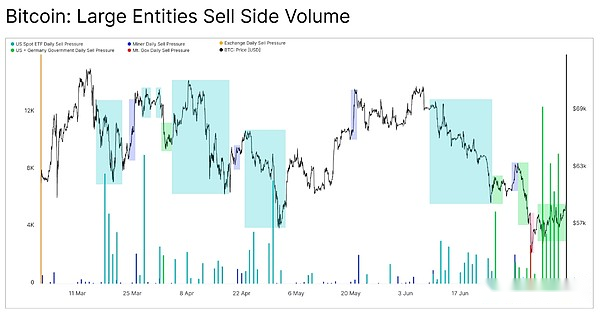
Taking this net flow dynamic as our benchmark, we can measure the estimated seller pressure intensity of large entities by isolating only net outflows.From this, three key observations can be obtained:
-
Increased seller pressure by miners often occurs during periods of price fluctuations.
-
After the market hit a new high in March, ETF outflows dominated, which was dominated by GBTC products.
-
Seller funds from the German government over the past few weeks have been huge.However, we can also see that most outflows occur after the price drops to $54,000, which suggests that the market is actually snatching ahead of the news.
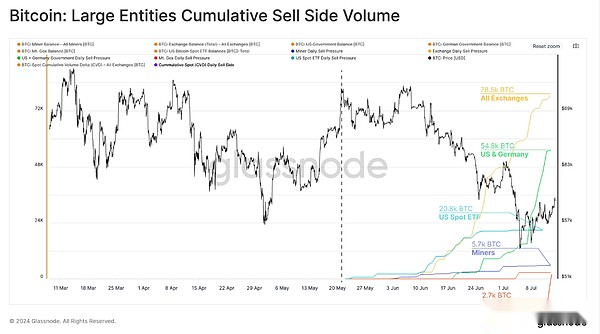
The chart below shows the cumulative net outflow activity of these large entities since the all-time high of $73,000.From this we can see thatSellers from miners are under relatively less pressure compared to government sellers, ETF outflows and exchange deposits.
Centralized exchange deposits remain the most stressful and most lasting source of sellers.However, even with these major trading venues as the cap, we can see that the recent large size of sellers from the German government is coming from.
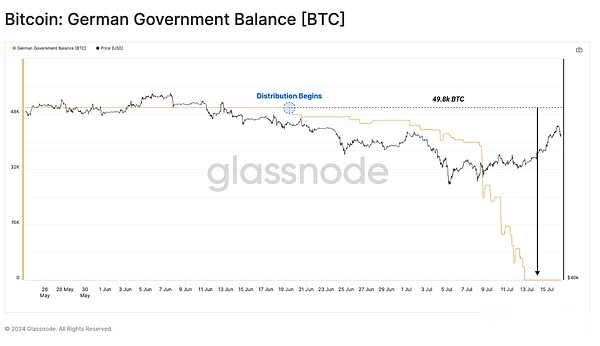
As our focus on the pressure on the German government to sell off continues to rise, we can see that their 48.8k BTC balance was exhausted in just a few weeks.Most of the funds were out of the money in a very short time between July 7 and July 10, with more than 39.8k BTC out of the tagged wallet.
Interestingly, this sell-off happened after the market bottomed out at around $54,000, which suggests that the market was ahead of the news.
Stability and Speculation
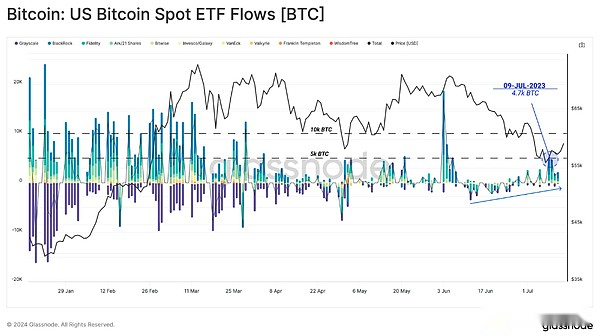
After a long period of oscillating range trading, the total net inflows of all ETFs experienced continuous capital outflows.As the price drops to a low of $54,000, the average inflow cost base for ETF holders has fallen below, currently at $58,200.
In response, ETFs have seen significant positive earnings for the first time since early June, with over $1 billion in total inflows last week alone.
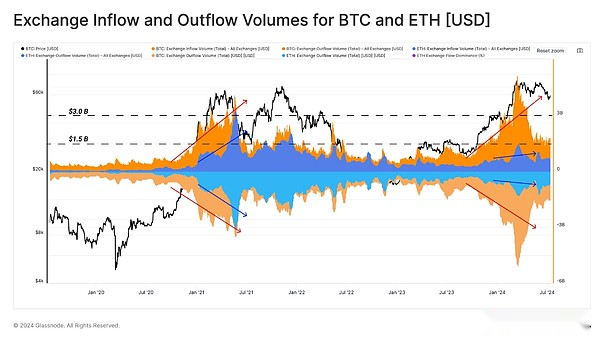
The deposit and withdrawal of exchanges are often powerful indicators for measuring investor interest and market liquidity.After hitting an all-time high in March, exchange traffic dropped significantly, andBTC trading volume (red)Since then, it has maintained a stable baseline of about $1.5 billion per day.
If we compareEthereum (blue)The inflow and outflow structure will be foundFor the 2021 bull market cycle, interest in Ethereum has significantly decreased.At the peak of the 2021 bull cycle, ETH’s daily exchange traffic was almost as large as BTC.
This suggests that the level of speculative interest in 2024 is relatively low, consistent with the generally weaker performance of ETH relative to BTC since the 2022 cycle lows.
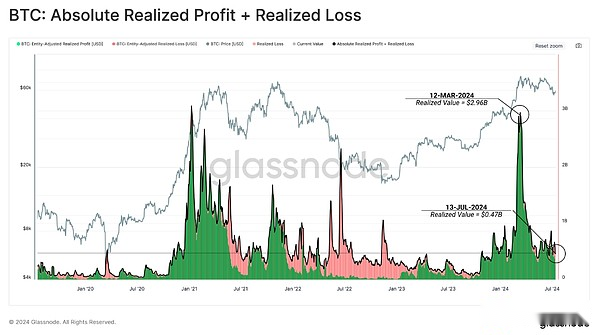
The scale of realized profits and losses that investors locked in can also serve as an alternative indicator of demand.Through this indicator, we can see a similar situation, with a large amount of demand supporting the uptrend, followed by a period of compression and consolidation.
This highlights the balance being established between supply and demand over the past 3 months.We can also see,Although the market has pulled back more than -25% from its highs, the loss achieved has not increased significantly so far, indicating limited panic.
Seller’s net amount
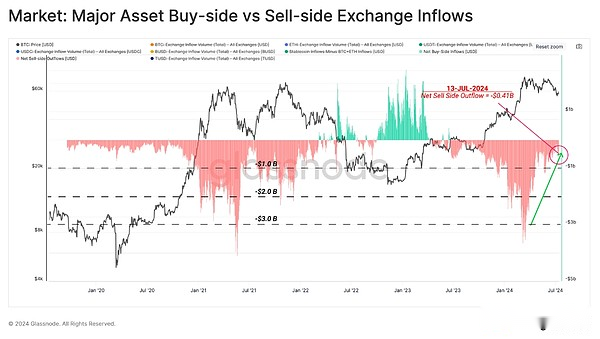
If we consider exchange inflows of BTC and ETH as seller pressure, we can compare it with the inflows of stablecoins, representing the proxy for demand.Through this indicator, we are able to assess the overall balance between buyer or seller bias in the market.
We can consider this through the following framework:
Values close to zero indicate a neutral mechanism in which buyer inflows are comparable to seller pressure from both major assets.
-
Positive values indicate that there is a net buyer mechanism in which the stablecoin buyer exceeds the seller of the main assets.(green)
-
Negative values indicate that there is a net seller mechanism where seller transactions exceed the available new stablecoin capital to absorb it.(red)
We can see,The market has been on a net seller mechanism since mid-2023, but this mechanism has been declining over the past few months.
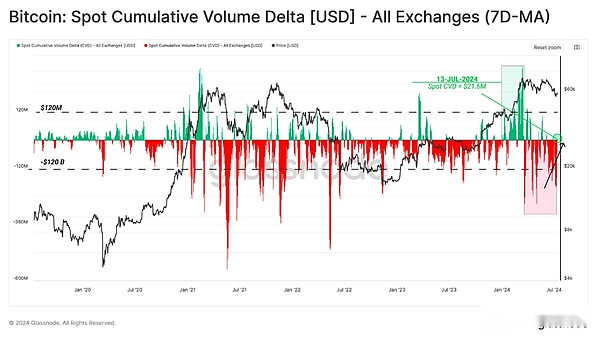
Using the spot cumulative volume increment (CVD) indicator, we can see similar dynamics.This tool measures the net difference between trading volumes on a centralized exchange.
From this perspective, we can seeSellers have taken a significant dominance since setting an all-time high in March.However, as of last week, CVD has recorded its first net buyer indicator since July, indicating a weakening seller pressure on the spot market.
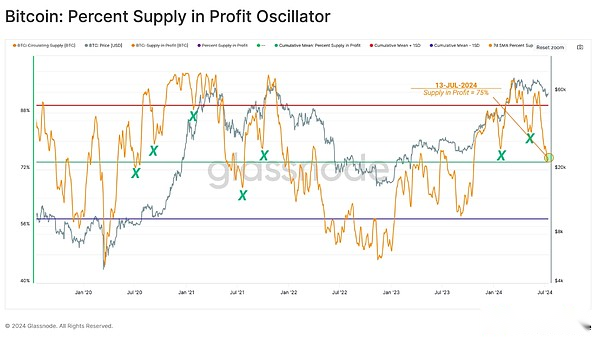
Investor profitability remains strong
As Bitcoin price fell to a local low of $535,000, the proportion of money supply that had not achieved losses soared to around 25% of the money supply.This has brought the profit supply percentage indicator back to its long-term average of 75%, which is its historical level during previous bull market adjustments.
By separating the percentage of token supply held by long-term and short-term holders, we can evaluate the impact of price contractions on both groups.
Over the past 30 days, the profitability of the short-term holder (STH) population has dropped sharply, with supply exceeding -66% turning into unrealized losses.This is one of the biggest drops in STH’s profitability on record.
This shows thatA large number of “top buyers” have been challenged in portfolio profitability in recent weeks.
However, for the opposite group, i.e.Long-term holders, the proportion of profits they hold has almost no change.This shows that during the peak of the 2021 bull market, relatively few investors still hold tokens.
Overall, this showsThe STH group remains the main group most likely to respond to market volatility, their average cost base is currently around 64.3k.

Summarize
Examine the scale of the main seller’s strength,Miners have historically been the main source of seller pressure, however, we have noticed that with each halving, their impact on the market is decreasing.In contrast, the correlation between ETF traffic and centralized exchanges on price behavior has grown convincingly.
The Bitcoin market absorbed 48,000 BTC last month as the German government achieved a full distribution of its balance sheet.The complete decline in seller pressure from the German government has provided adequate relief for the market, and initial signs of a reappearance of demand side have stimulated positive price action.
Short-term holders have experienced a challenging month, with recent adjustments leaving a large portion of their token supply at a loss.On the contrary, mature investors remain unwavering and have barely declined in profitability, underlining their impressive beliefs and solid market positioning.