
Author: Matthias Andrad Source: Coin Metrics Translation: Shan Oppa, Bitchain Vision
Key points:
-
During the crash, the Ethereum blockchain maintained consistent trading activity, with USDC trading activity increasing to nearly 30K txs/hour during this period.
-
However, due to all of this activity, gas fees soared to more than 5 ETH per block, but the network still functioned properly, allowing transactions at higher costs.
-
Ethereum futures open contracts fell by $4.1 billion, providing insights into market sentiment and future price trends, especially for traders or assets such as USDe who rely on ETH arbitrage trading profitability.
introduce
The recent collapse of the cryptocurrency market has once again attracted attention to the stability and resilience of the crypto ecosystem.In this article we evaluate the performance of various elements in the crypto field during and after the crash and compare it with traditional financial markets.We will focus on two key areas: the robustness of decentralized systems and the stability of synthetic financial products within the crypto ecosystem.
Risks of licensing financing
In the recent market crash, the cryptocurrency licenseless system taking Ethereum as an example forms a sharp contrast with traditional financial markets.The Ethereum blockchain operates around the clock and can achieve uninterrupted transactions, while the transaction time in traditional markets is limited.However, although sufficiently motivated traders are able to interact freely, the cost is to pay gas fees; similarly, or slippage similar to traditional markets.
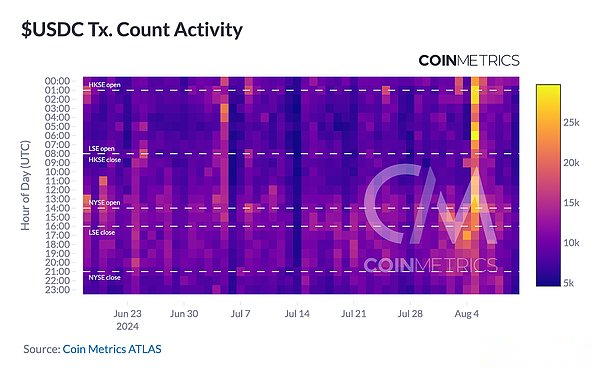
Source: Coin Metrics Stablecoin Dashboard
As shown in the above figure, USDC’s transaction activity shows that the Ethereum network maintained consistent activity throughout the crash without any errors.Users can continue trading, although the fees will be higher due to increased network congestion.This accessibility contrasts sharply with many traditional financial brokers who reported downtime and maintenance issues during the same period.
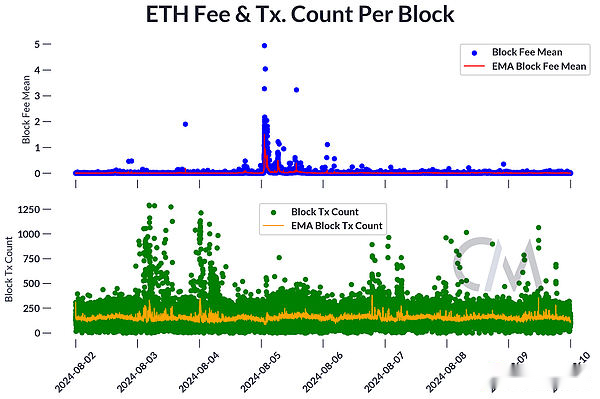
Source: Coin Metrics Network Data Pro
As shown in the above figure, during the crash, Ethereum’s gas expenses rose sharply, with gas expenses rising by more than 5 ETH for a single block.Although transaction costs have increased significantly, it should be noted that the cost increase is temporary, and most importantly, the network is still functioning normally, and if users are willing to pay higher fees, they can execute transactions.
On-chain rate of return primitive
As various crypto financial products mature, market participants have developed new innovative ways to generate returns for on-chain investors.Unlike traditional stablecoins that may rely on off-chain collateral or centralized mechanisms to maintain pegged, Ethena’s USDe is primarily powered by on-chain assets and protocols (although still interacting with CEX).
USDe is a synthetic stablecoin product created by Ethena on the Ethereum blockchain.Unlike traditional stablecoins backed by fiat currencies, USDe relies on different ways to maintain its peg to the US dollar.USDe relies on pledging ETH and shorting perpetual futures to generate returns from the US dollar neutral portfolio, creating a “synthetic dollar bond” that tracks the US dollar while providing at least part of the return native to the Ethereum blockchain.We can see USDe’s price activity in the last few days of August in the chart below, noting that the market will keep the peg rate within 0.3% of the face value of USD 1.
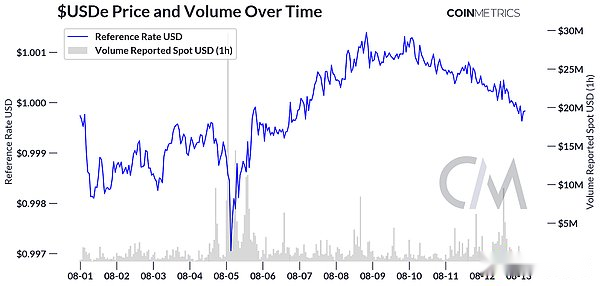
Source: Coin Metrics Market Data
One of the main concerns about USDe is its reliance on centralized controls and the potential vulnerability that arises, especially the ongoing positive financing rate requirements, which are crucial to its sustainability pegged to the dollar.However, during the weekend’s market adjustment, most ETH futures markets have negative annualized financing rates, although by August 13, exceptfewException, most markets have negative financing rates.
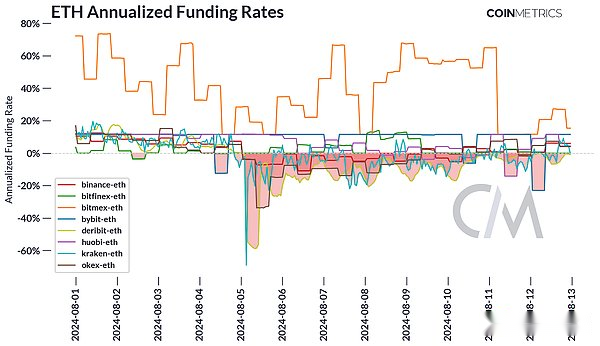
Source: Coin Metrics Market Data
As shown in the figure below, market participants reduced long exposure to ETH during the crash, or were liquidated.Forced liquidation of these leveraged long positions has led to a further decline in open contracts as open futures contracts are closed in large quantities.This self-reinforcement cycle of price declines, margin additions and liquidation may exacerbate market sell-offs.Savvy investors can use closely monitoring market liquidation to understand market characteristics, understand potential dynamics driving changes in digital asset prices, and adjust trading strategies accordingly.
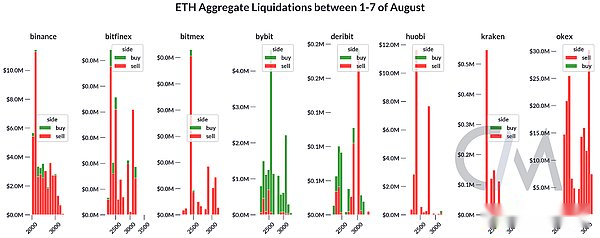
Source: Coin Metrics Market Data
The decrease in position is usually accompanied by or accompanied by a substantial fluctuation or sell-off of the underlying asset price, as traders become more risk averse and close leveraged positions.The reduction in holdings can provide insight into the overall market sentiment and the possibility of future price trends.In the figure below, we can see that positions measured by the grey dotted line have decreased by about $4.1 billion.
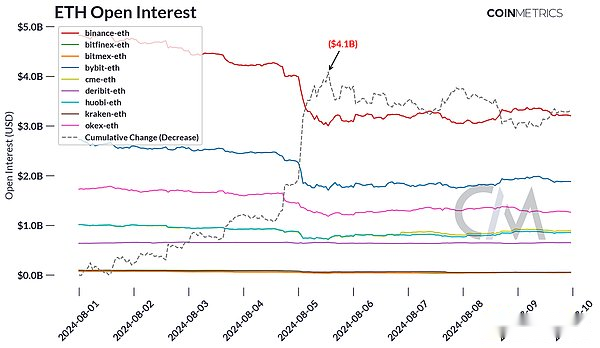
Source: Coin Metrics Market Data
By analyzing changes in open positions and the price trends of ETH, one can better understand the dynamics and sentiment of the Ethereum futures market, thereby informing trading strategies and risk management decisions.
in conclusion
The recent crypto market crash provides valuable experience in understanding the strengths and weaknesses of the crypto ecosystem.While permissionless systems show extraordinary resilience in accessibility and functionality, they also face challenges such as high transaction costs under pressure.Synthetic products like USDE show impressive stability, highlighting the potential of well-designed DeFi tools, while also highlighting the importance of tracking the performance of underlying portfolios when considering future stability.By leveraging the benefits inherent in the blockchain ecosystem, these innovative financial products provide a compelling alternative to traditional revenue generation tools.