Author: LD capital, Duoduo
Last week, BTC broke through the highest level of 64,000, which is very close to the high of the previous bull market of 69,000.At the same time, the prices of newly issued assets in the market are also being pushed up, and the bubble is forming and amplifying.For players who have built positions in BTC in the past two years, we have begun to think about a question: What stage is BTC currently in?When should we take profit and leave?
Glassnode provides a large number of BTC analysis indicators, selecting two indicators: NUPL, Net Unrealized Profit/Loss and Long/Short-Term Holder Threshold, to see the marketlocation.
Net profit and loss not realized (NUPL, Net Unrealized Profit/Loss)
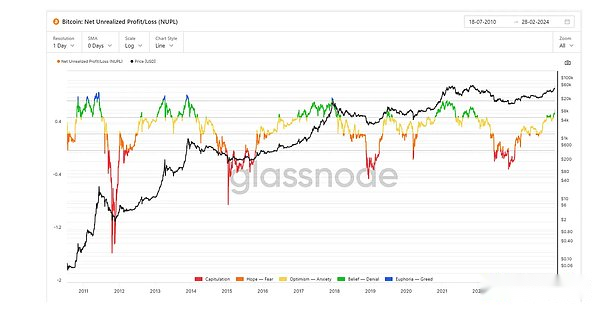
The question that the unrealized net profit and loss (NUPL) attempts to answer is: at any given point in time, how much of the Bitcoin circulating supply is profitable or lossy, and how much it is profitable or lossy?
NUPL describes the overall profit and loss status of BTC by calculating the difference between the current market value and the realized market value.The NUPL calculation formula is: (Market Cap — Realised Cap) / Market Cap.The market value has been realized, which is the value obtained by adding the accumulated price of Bitcoin during the previous move.The current market value is minus the realized market value and the unrealized market value is obtained.If the market value is not realized as negative, the market as a whole is in a loss state; if it is a positive, it means the overall market profit.If the profit or loss is not realized is divided by the current market value, the specific value of NUPL is obtained.The smaller the profit, the greater the loss, the closer to the bottom; the greater the profit, the smaller the loss, the closer to the top.
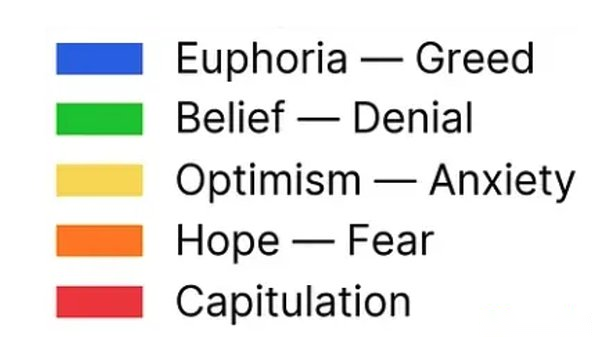
NUPL is divided into 5 areas, the red area is below 0, which belongs to the loss area, and is also the buying range at this time.The orange area is between 0–0.25, which belongs to the micro-profit area.The yellow area is 0.25–0.5.The green area is 0.5–0.75.The blue area is above 0.75.Generally, it is a better buying area below 0.25, and a bull market may be entered if it is above 0.5.
By observing history, you can see:
1. NUPL makes a good reminder of the bottom area.The second half of 2022 will be basically below zero.The tips for the top interval are relatively broad.The bull market in 2017 had a very short time to touch the blue area, and in 2021 it did not touch the blue area at all. The entire bull market was running in the green area.This increases the difficulty of judging the top area.
As for our current position, we are in the green area from early December to early January, and then fell into the yellow area for nearly a month, and entered the green area again on February 7.It is currently the second time this cycle has entered the green area, which lasts for nearly a month.
2. From December 2016 to January 2018, NUPL is basically in the green area for a period of 14 months.During this period, BTC rose from $780 to $17,000, an increase of about 21 times.
NUPL is also located in the green area for an 11-month period from October 2020 to May 2021, and from August 2021 to December 2021.From October 2020 to May 2021, BTC rose from US$13,000 to US$63,000, an increase of about 4.8 times.
From the perspective of duration, the green area lasted for more than 10 months.
3. It should be noted that the start of the main upward wave of the first two bull markets was after the halving.Compared with this year, BTC has approached a new high before the halving, and NUPL has also been operating in the green area for more than 2 months.This time, we cannot simply carve the boat and seek the sword according to the halving market.
In the previous two rounds of bull markets, the impact of BTC production cuts was great, resulting in a significant reduction in supply and an increase in mining costs, resulting in a situation of supply in short supply and a situation of price increase.In this bull market, most of BTC has entered circulation, and the impact of halving on supply is reduced; at this time, the passage of BTC ETFs has brought about a large number of buying orders, which has also caused a situation of supply shortage, and has led to an early start of the market..The BTC market will be more affected by US monetary policy and US stock market.
Long/Short-Term Holder Threshold
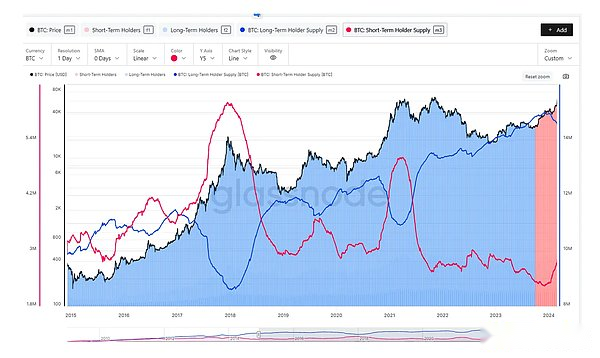
Long-term BTC refers to BTC that has not moved for more than 155 days in the same address, while short-term BTC refers to BTC that has been moved for more than 155 days in the same address.The change in this indicator shows when long-term holders are accumulating tokens and when they are selling tokens.
At present, the total amount of BTC held in the long term is about 14.5 million, and the total amount of BTC held in the short term is about 2.87 million, which shows that about 83% of BTC is in the long term.
By observing history, you can see:
1. In early January 2017, the price of BTC reached US$900. When it approached the bull market high of the end of 2013 (US$1,000), long-term BTC began to reduce its holdings and sell.The selling trend continued until early 2018.Correspondingly, the amount of BTC held in the short term has increased significantly.
2. In 2018, BTC was in a downward trend, and BTC, which was held for a long time, was in a growth trend. Investors continued to accumulate BTC during this period of time.
3. In April 2019, after BTC exceeded US$5,000, long-term BTC was reduced.By August 2019, after BTC fell, the number of long-term accumulated continued to rise until 2020.
4. In October 2020, after BTC exceeded US$11,000, long-term BTC was reduced.The trend of share reduction will continue until April 2021.
5. In November 2021 and June 2022, long-term BTC fell briefly, but it showed a continuous growth trend afterwards.
6. In early December 2023, long-term BTC began to reduce its holdings.From the highest peak of 14.98 million to 14.5 million, a decrease of about 500,000.At present, this trend is still continuing.
BTC market value share (BTC.D)
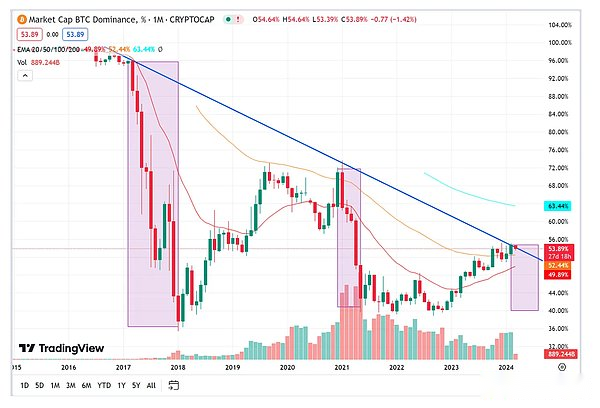
Currently, BTC market value accounts for 53.87% of the total market value of cryptocurrencies.
Observe the historical data and you can see:
1. The market value of BTC increases in bear markets and decreases in bull markets. The lows of the bull market in 2017 and 2021 are both around 40%.
2. In each bear market, the proportion of BTC market value is gradually decreasing, forming a trend line.The current proportion is still within the trend line range.Since this round of bear market, the highest proportion has been around 54%.
3. At the high point of the bull market, the market value of BTC should drop to about 40%.At present, the proportion of BTC’s market value has not yet shown a clear downward trend.
in conclusion
Unrealized net profit and loss (NUPL) is higher than 0.5, and BTC holds coin addresses to obtain more than 50% of unrealized profits.The BTCNUPL range above 0.5 lasted 14 months and 11 months in the 2017 and 2021 bull markets, respectively, and happened after the halving.This year, it has entered the general profit range for two months before the halving. The market is different from before, and may be more affected by US monetary policy and US stock market.For example, the determination of the time of interest rate cut may lead to a pullback in the market.
According to long-term and short-term holdings (Long/Short-Term Holder Threshold), long-term holdings are currently at a historical high.However, long-term holders have gradually reduced their holdings in BTC since December 2023.This behavior is similar to that in 2017 and 2020.Long-term holders will continue to sell between BTC breaking through the previous bull market high and the current bull market high.
Judging from the proportion of BTC market value (BTC.D), the proportion of BTC market value is still at a relatively high level, and there has not yet been a significant downward trend. The main upward trend of counterfeit general rise has not yet begun.
Overall, BTC is in the early stage of the main upward trend, and the main upward trend of the altcoin has not yet started.