Source: Glassnode; Compilation: Wuzhu, bitchain vision
summary
-
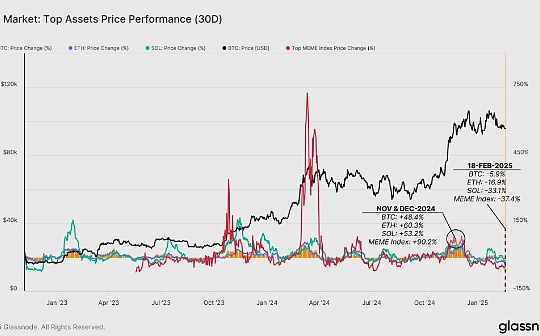
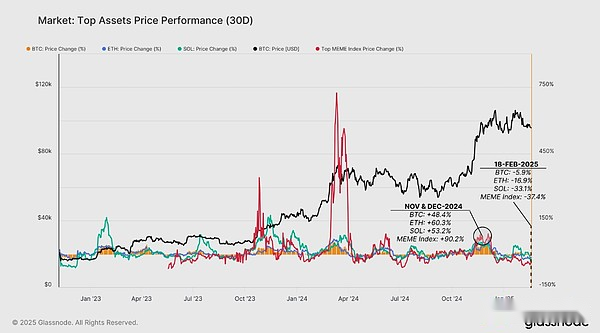
After Bitcoin broke through $105,000 for the second time at the end of January, the market entered a phase of contraction, with the monthly price momentum of major assets falling sharply.
-
Bitcoin remains relatively stable, while Ethereum, Solana and Memecoins are facing deeper adjustments, reflecting changes in risk appetite.
-
Solana has become a market leader in capital inflows over the past two years, while Ethereum has been relatively difficult to attract sustained demand.
-
However, this week, capital flows for all digital assets except Bitcoin have dropped sharply, and Solana and its associated memecoin ecosystem have been hit relatively hard.
-
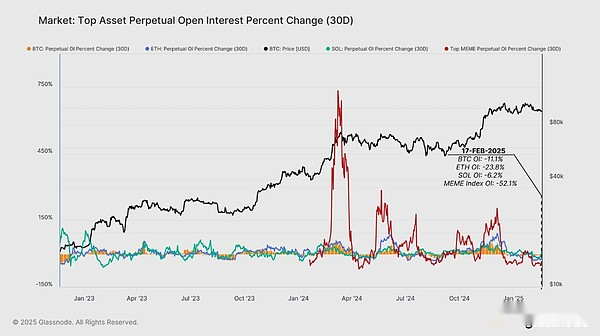
Perpetual futures open contracts for Bitcoin (-11.1%), Ethereum (-23.8%), Solana (-6.2%) and Memecoins Index (-52.1%) all declined, reflecting interest in leveraged speculationWeakened.
Market momentum takes a breath
In late January 2025, the Bitcoin market tried to break through its historical highs and return to the price discovery stage.However, the rebound failed to gain the necessary momentum, and the market has since entered a period of contraction and consolidation, with the price momentum of major assets falling sharply.
-
Bitcoin: +48.4% (November 2024) → -5.9% (February 2025)
-
Ethereum: +60.3% (December 2024) → -16.9% (February 2025)
-
Solana: +53.2% (November 2024) → -33.1% (February 2025)
-
Meme Coins Index: +90.2% (December 2024) → -37.4% (February 2025)
It is worth noting thatMemecoins and Solana thrived under strong market trends, but also tended to pull back sharply during downturns.Ethereum has been one of the weakest currencies throughout the cycle, and while it outperformed Solana this week, a strong overt trend has not yet formed.
Assess performance to date
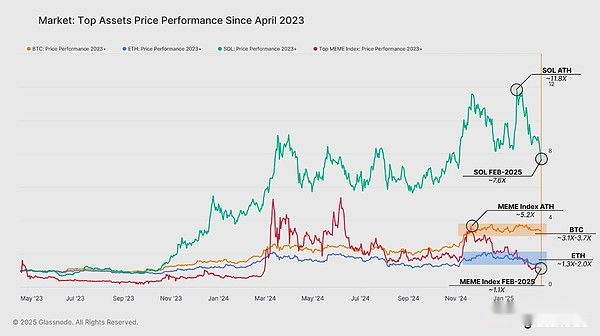
The recent slowdown comes after a long period of strong growth in major digital assets.Looking at the performance since the beginning of 2023, we can see that there are significant differences in the performance of each asset in the cycle so far:
-
Bitcoin’s trading range is about 3.4 times higher than in April 2023, providing a benchmark return overview.
-
Compared with its peers, Ethereum struggled, with returns ranging from 1.3 to 2.0 times compared to April 2023.
-
Solana’s return since 2023 peaked at 11.8 times in early January 2025, but has since dropped sharply to around 7.6 times as the current correction is implemented.
-
Memecoins Index: The price surge in mid-2024 is basically consistent with Solana’s outstanding performance, reaching a 5.2x peak since 2023.However, the industry has been hit quite hard in recent weeks, with overall performance now the worst of four assets.
This reflects the high beta characteristics of Solana, which has experienced both the strongest gains and the most drastic pullback.Bitcoin’s more stable trend highlights its resilience as a benchmark return feature in the digital asset field.Memecoins, in particular, has seen a significant decline in investor demand recently, indicating a change in risk appetite.
Capital flows drive market
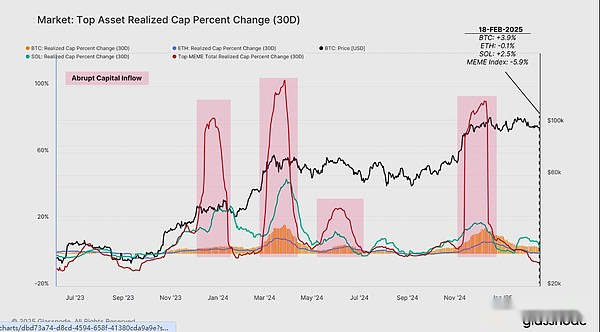
Solana’s strong performance over the past two years is consistent with the ongoing capital inflows brought about by investor demand.Judging from the monthly changes in the realized market value, we can see that the capital flow patterns of various digital assets are clear:
-
Solana:It has been attracting higher relative capital inflows, supporting its strong price appreciation.
-
Ethereum:Among the major currencies, net capital inflows are the weakest, which explains the relative underperformance.
-
Memecoins:Several sudden but unsustainable capital inflows have experienced a surge, reflecting speculative outbreaks, but without sustained momentum.
However, capital inflow momentum for all digital assets has declined in recent weeks.It is worth noting that Ethereum and top Memecoins have now turned negative (capital outflow), with Ethereum’s net outflow of market capitalization of -0.1%, while the Memecoins index has a more drastic net outflow of -5.9%.
This suggests a significant cooling of speculative desire and suggests that capital may flow out of riskier assets in the future.
Futures market weak
As the spot market momentum begins to weaken, we can also see a decline in capital inflows in the perpetual futures market.Spot demand cooled down sharply in perpetual open interest contracts (OIs) for all major assets, indicating a decrease in speculation and a decline in spot and arbitrage yields.
Over the past 30 days, the rate of change in open positions highlights the general retreat of capital:
-
Bitcoin OI: -11.1%
-
Ethereum OI: -23.8%
-
Solana OI: -6.2%
-
Memecoins OI: -52.1%
The trend of a comprehensive decline in open positions indicates that speculators are reducing leverage exposure, which may be due to weakening market momentum and increased market uncertainty.The biggest drop is Memecoin, which tends to attract more short-term leverage bets, but it quickly loses its appeal as long as market sentiment weakens.
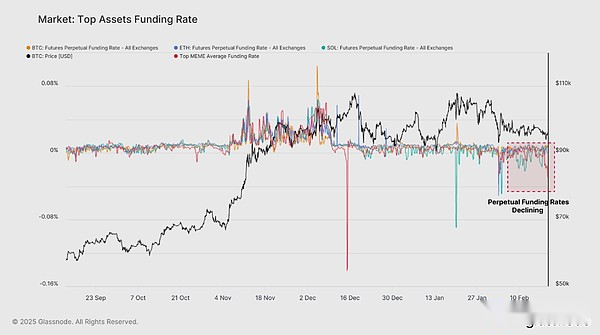
Financing rates show bearish sentiment
The decline in perpetual futures financing rates further exacerbated the weakness of open positions.This reflects a shift in bearish sentiment and closing of leveraged positions, especially in riskier assets.
-
The financing rates for Bitcoin and Ethereum are still slightly positive, and their deeper liquidity profile tend to have positive financing rates unless during events where leverage ratios are significantly lower.
-
Solana’s financing rate has been slightly lower and negative in recent weeks, indicating that demand for long speculative positions is cooling.
-
Memecoins’ financing rates have turned to very negative levels, indicating that shorts are now dominant in these highly speculative assets, with many traders closing positions (or being liquidated).
Negative financing rates for Solana and Memecoins indicate a net turnover of bearish sentiment in high-risk assets and excessive long leverage is closed.
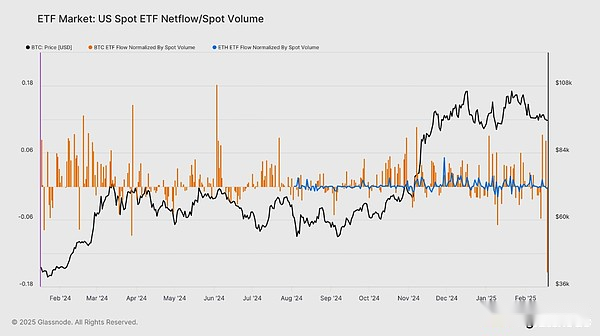
ETF traffic and market impact
As the market is in a contraction phase, institutional interest in Bitcoin and Ethereum has slowed down based on spot ETF traffic.By standardizing net inflows with native spot volumes of each asset, we can measure the weight and impact of ETFs on market dynamics.
-
Last week, Bitcoin ETFs had outflows of more than $200 million per day, but then a strong rebound in buyer activity, surpassing 8% of global spot trading volume, highlighting institutional demand (similar to “buy on dips” behavior).
-
Demand for Ethereum ETFs has cooled significantly, and the scale is still much smaller than Bitcoin.ETH’s ETF activity hovered near zero in terms of net inflows and outflows, indicating a lack of strong traditional investor demand and participation.
So far, this divergence has been the subject of this market cycle and has cemented Bitcoin’s dominance in the institutional portfolio.Ethereum still struggles to attract a large amount of continuous capital inflows, which further explains the relatively poor performance in recent years.
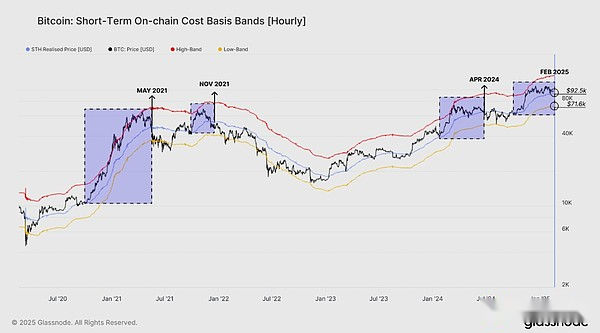
Key bull and bear thresholds
Bitcoin is currently trading at $1,000-$5,000 above the Short-term Holder (STH) cost base, at $92,500.Historically, this level has been a key pivot point between local bull and bear phases, and is the pivot point for recent average buyers to move between unrealized profits and losses.
Looking back at the previous situation where Bitcoin hit a new high and then revised downward, we can see similar patterns in May 2021, November 2021, April 2024 and February 2024.
In each case, the downward trend extends to the lower limit of the STH cost basis model, specifically -1 standard deviation (σ).Currently, this lower limit is at $71,600, helping to predict the downside risks that may occur if these historical patterns repeat.
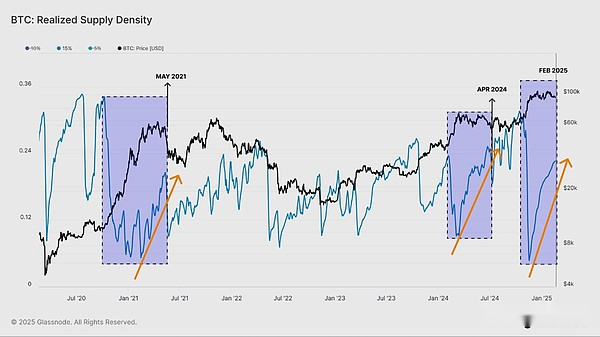
Consolidation after a record high
In previous examples where Bitcoin hit a new high, we observed a consistent post-rebound pattern where the surge in actual supply density occurred within ±15% of the spot price.This is due to the market’s transition from a radical upward trend to a price consolidation as the market trades within a relatively narrow range.
This behavior is evident at the top of previous cycles, where:
-
As the market rebounds within the price discovery range, the actual supply density has fallen all the way to the price peak.
-
Then, when the market enters the adjustment or consolidation phase, market participants begin to redistribute tokens.
-
This usually happens when approaching the STH cost base, as new investors’ beliefs and demand conditions are tested.
The current actual supply density is consistent with the typical ATH post-consolidation phase, with buyers and sellers trying to establish a new balance before the next major trend unfolds.
Close to the decisive market moment
To better understand the market’s sensitivity to this supply density, we can analyze the supply held by short-term holders (STHs) in the recent post-ATH distribution stage.This helps measure the pattern of accumulation of new investors and whether the current situation is similar to past cycle peaks.
When comparing the STH supply changes, we observed:
-
The recent accumulation phase is very similar to May 2021, indicating that supply is equally large and investors will be sensitive to price drops below $925,000.
-
New investors also accumulated a lot in April 2024, but the magnitude of the upward trend of STH supply in the current cycle is more structurally consistent with May 2021 rather than 2024.
Given these similarities, we are now very close to the decisive moment of the market—the stage where price action is ready to unfold.If demand remains strong, Bitcoin may establish a new range above ATH.However, the lack of ongoing buying pressure may lead to a deeper allocation-driven adjustment similar to the previous post-ATH phase.This may be driven by recent panic among buyers who have seen their recent purchases go from profitable to unrealized losses in holding.
in conclusion
Bitcoin has been consolidating around $95,000 for several weeks, with a relatively stable trading range.But this is not the case in the broader digital asset sector, with Ethereum, Solana and Memecoins all falling sharply from cyclical highs.In particular, the demand for Memecoins has cooled significantly, with capital outflows, sharp declines in prices and bearish sentiment in the futures market.
For Bitcoin, the key level to focus on is that the short-term holder cost base is around $925,000.This is a key point, and most buyers’ holdings will turn into unrealized losses in the near future.As panic emerges, this may lead to more declines.In either case, the current consolidation phase seems to be approaching the later stage, and the market seems ready to move in one direction again.