
Author: UkuriaOC, CryptoVizArt, Glassnode; Compiled by Deng Tong, Bitchain Vision
summary
-
Net capital inflows of Bitcoin assets have cooled significantly, and there are few profit and loss events for investors.
-
Loss events are almost entirely related to the short-term holder group.
-
However, a large portion of the supply held by the group is transforming into long-term holders, with a holding time of at least 155 days.
-
Speculation in the perpetual swap market has undergone a full reset, indicating that speculative interest and long leverage are cooling down.
Liquidity
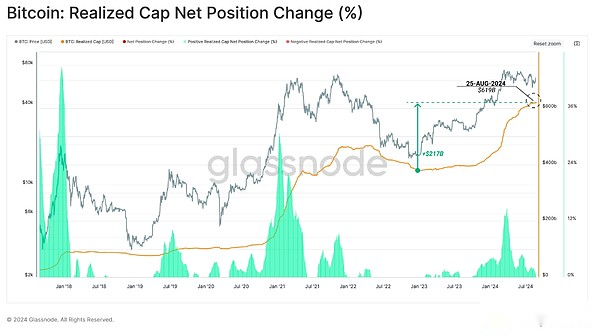
Net capital inflows to Bitcoin assets have begun to slow down over the past few months.This shows that there is a certain balance between investors’ profits and losses.
It is worth noting that capital inflows in the Bitcoin market are rarely so calm, with capital inflows greater than today on 89% of the days (except for losses-dominated bear markets).It is also worth noting that similar periods of inactive tend to precede a significant increase in future volatility.
The actual market capitalization remains at $619 billion ATH, with net inflows reaching $217 billion since the low of $15,000 set in December 2022.
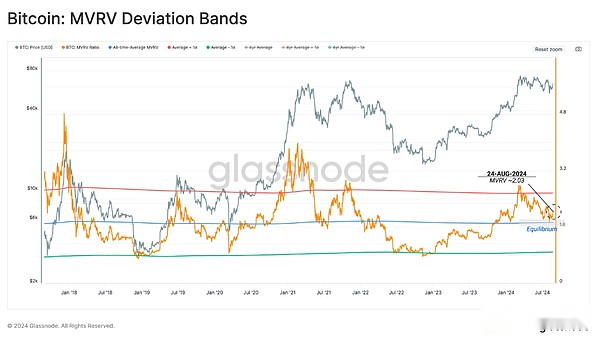
MVRV ratios are a powerful tool that allows us to measure the average unrealized profits of investors.
The MVRV ratio has tested its historical average of 1.72 in the past two weeks.Historically, this key level marks a turning point between a macro bull market and a bear market trend.About 51% of the trading days closed above the average.
This showsInvestor profitability has basically returned to a balanced position, and the excitement and enthusiasm after the launch of the ETF has completely cooled down.
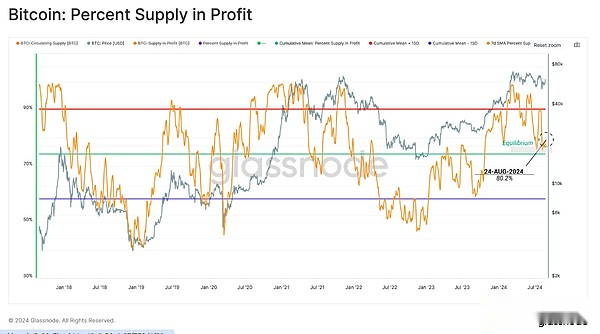
The percentage of supply in the profit indicator also reflects a similar situation, which provides a reading of supplying global profitability.
Like the MVRV ratio, this oscillation index has been restored to its long-term average.Similar retests of this level have occurred before, both during the late 2016, throughout the 2019 volatility period, and during the mid-2021 sell-off period.
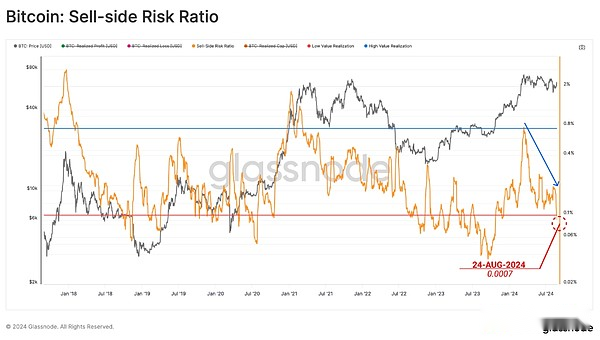
Seller risk ratio is another powerful tool that can assess the level of equilibrium achieved by the market.We can consider this indicator under the following framework:
-
A high value indicates that the investor spends the token’s profit or loss is greater than its cost basis.This situation suggests that the market may need to re-find a balance and will usually occur after a high volatility price action.
-
A low value indicates that most tokens spend relatively close to their break-even cost basis, indicating that a certain level of balance has been reached.This situation usually indicates that the “profit and loss” in the current price range has been exhausted, and usually describes a low volatility environment.
at present,The seller risk ratio has dropped to a lower level, indicating that most of the on-chain transfers trade tokens close to their original acquisition price.Similar to the indicators introduced earlier, this indicates a new state of intensification of volatility.
Short-term pressure
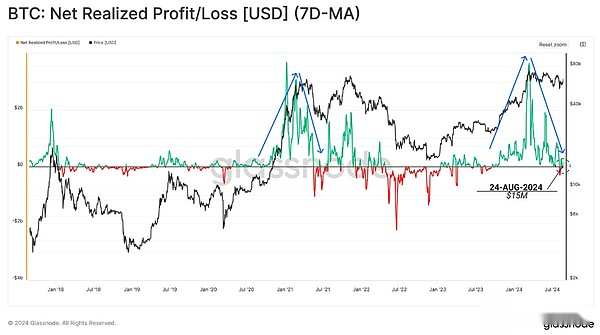
Deeply studying these profit-making and loss-making activities, we can see that the net realized profit/loss is declining.
Net realized profit/loss is currently +$15 million per day, a far cry from the $3.6 billion inflow of capital inflows when the market hit a $73,000 high in March.Typically, the indicator returns to a neutral level near the inflection point, such as the trend continues or reversals back to a macro bearish trend.
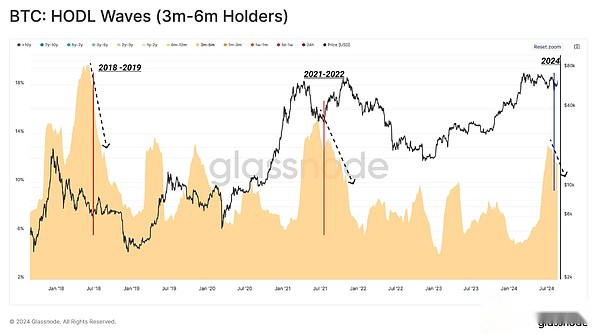
After hitting record highs in March, new investors’ confidence has been tested in months of fluctuating sideways price movements.During this process, the large amount of Bitcoin supply is still strictly controlled, within the age range of 3 months to 6 months.
Historically, supply in this 3-6-month age range often peaks shortly after the peak of major markets, usually during subsequent adjustments.Some of these new investors then decide to continue holding under volatile conditions and eventually become long-term investors.Many others exit positions and realize losses.
at present,The 3-6-month tokens account for more than 12.5% of the circulating supply, and its structure is similar to the mid-2021 sell-off, but also to the peak of the 2018 bear market.
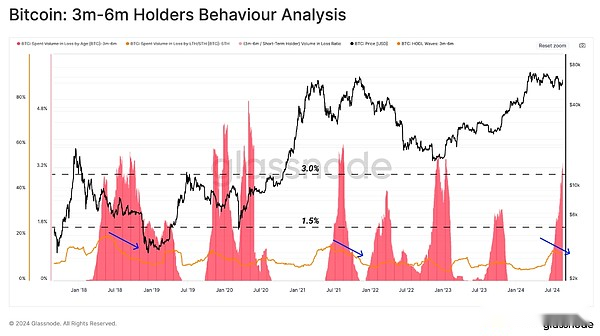
The following chart aims to further break down this group and compare the supply held to the loss in the 3-6 month period.We start with the 3-6 month holding supply displayed in (dots) and then superimpose the number of losses transferred in that group (cube).
From this, we can observe that loss events have increased significantly since early July, while the total supply held has begun to decline.In terms of scale, the scale of this sell-off is similar to the major market turning point in the past.
The supply, still in this timeframe of holding coins, is getting closer to entering a long-term holder state, which means that statistically, the possibility of these tokens being spent on one day is less likely.
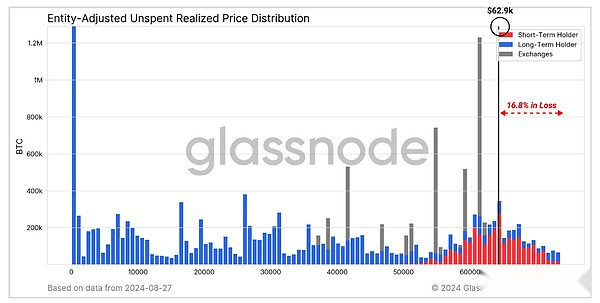
Another way to visualize the migration of tokens to LTH state is through the URPD metric, which distinguishes between long-term holders and short-term holders.Here we can see that the acquisition price over +480k BTC is higher than the current spot price and is now classified as an LTH supply (block).
This also means that these LTH tokens are now in an unrealized loss state.
Short-term changeable
In the last section, we will add analysis of the perpetual swap market that provides an interpretation of speculative and leverage demand in the Bitcoin market.
Overall,Removal volumes have dropped significantly in recent months, especially in relation to the excitement of setting an all-time high in March.This indicates that speculative demand has declined and indicates that the current market mechanism is more focused on spot.
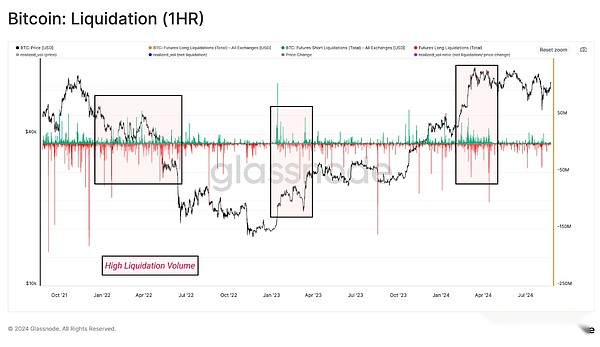
If we compare monthly price volatility with net liquidation, we can see a strong correlation between these two factors.This underscores that market volatility is often exacerbated by the squeeze of leveraged positions, as traders find themselves in an offside position when the market fluctuates.
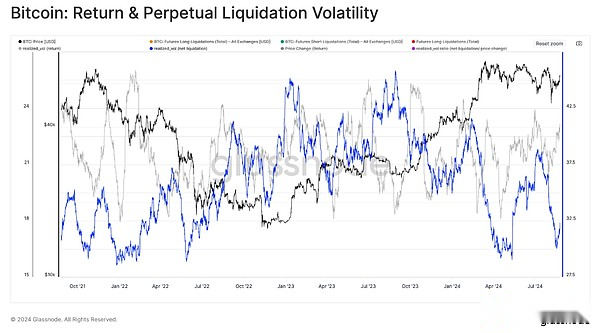
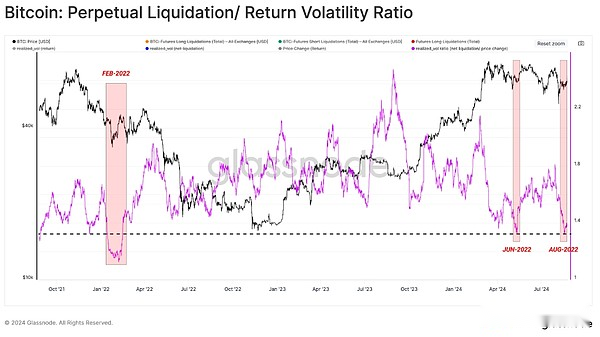
We can also study the ratio between price and net liquidation volatility to understand the market’s interest in leverage.
We found that this rate is falling to its lowest level since February 2022.This reinforces the view that traders are less willing to take on high-risk positions, suggesting speculative interest has been significantly reset.
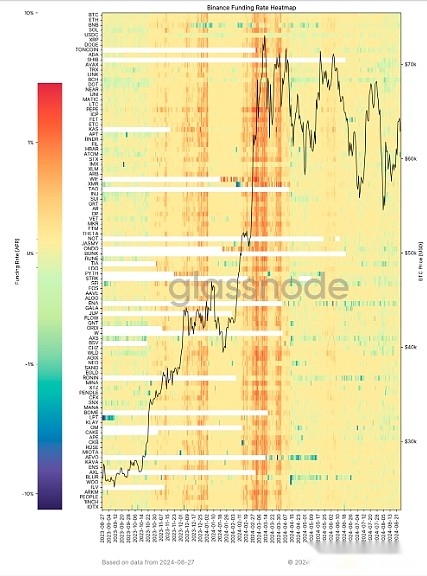
This phenomenon can also be seen in the broader digital asset ecosystem, with a large number of tokens now showing neutral financing rates.This emphasizes the view that speculative interest in the entire market has undergone a significant reset and that the spot market is likely to dominate in the short term.
Summarize
There has been a certain degree of balance in both the on-chain field and the perpetual futures market.This can be observed by the reduction of profit-making and loss-making activity and the return neutrality of financing rates across the digital asset sector.This shows thatRegardless of the instrument or asset class, speculative activity among market investors has dropped significantly.
In addition, with the arrival of integration and accumulation, the market has been in a downward trend with orderly structures for more than 5 months.However, in terms of historical preference,Calm market structure periods are short-lived and often precede expectations of increased volatility.