Source: Glassnode; Compilation: Tao Zhu, Bitchain Vision
summary
-
Bitcoin investors suffered huge losses during the economic downturn, and the price of BTC fell to $93,000 at one point.
-
However, when we normalize these losses to BTC denominations, the severity of the losses appears to be consistent with other local adjustments.
-
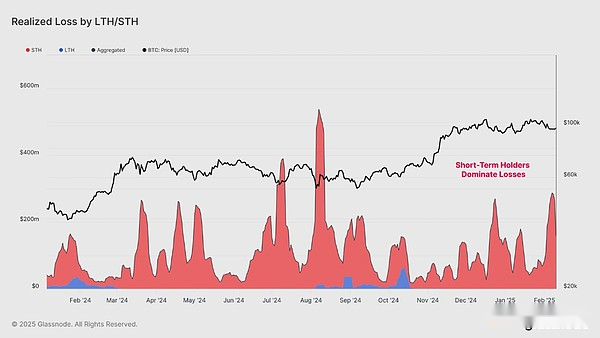
Most lock-in losses come from the short-term holder population as the profitability of local top buyers has rapidly declined.
-
The altcoin industry suffered the worst relative losses during the economic downturn, and the global altcoin market value experienced one of the biggest depreciation ever.
Significant depreciation
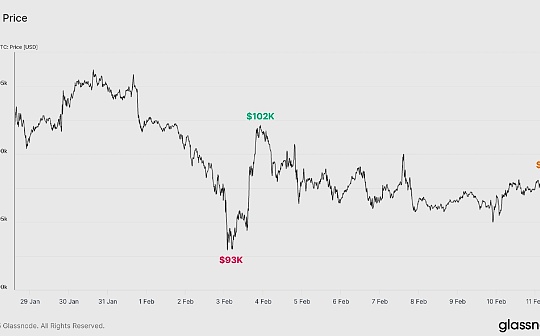
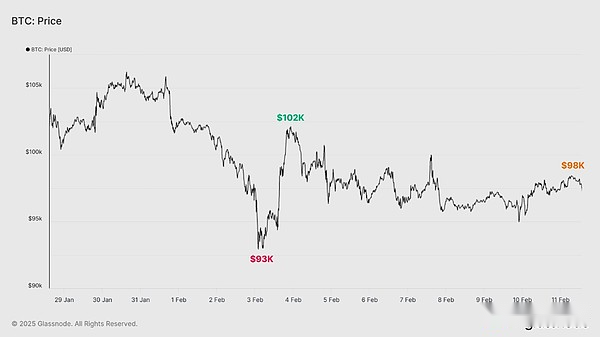
Last week, Bitcoin investors experienced drastic price volatility.BTC price initially fell to a low of $93,000 before briefly retracing to $102,000, and is currently trading at close to $98,000.ThisThe hesitant price movement is primarily a response to President Trump’s threat to impose tariffs on Canada, Mexico and China, which provides investors with an uncertain macro backdrop.In addition, the continued strengthening of the US dollar has also led to a slightly tight liquidity environment.
While the price of Bitcoin has fluctuated greatly in recent weeks, it has not deviated too far from its starting position during this period, becauseDaily fluctuations and horizontal consolidation continue.
How does the composition of Bitcoin investors evolve this cycle?Bitcoin’s liquidity has increased significantly, and greater capital flows are balancing the inertia of increasingly larger assets.In addition, even in a relatively unstable macro context, an increasing number of tenacious and patient holders contribute to the stability of Bitcoin prices.
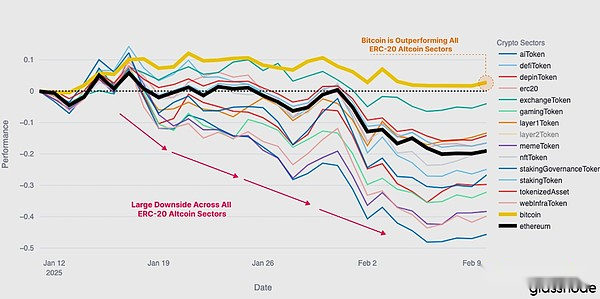
on the other hand,The altcoin industry has experienced huge sell-side pressure, and many assets are difficult to achieve widespread adoption or product-to-market fit, which makes the market environment even more severe.This ultimately led to a sharp decline in token prices, and all altcoin sub-industries have performed worse than Bitcoin in recent weeks.
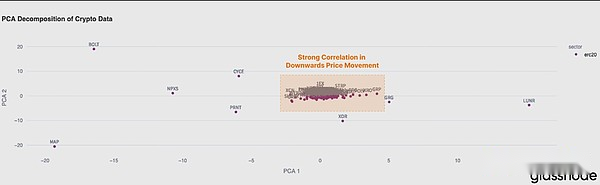
To explore the downward price trends in the altcoin field, we can use principal component analysis (PCA) to project the correlation of token returns into two-dimensional space.This visualization helps identify tokens that perform similarly (gathered together) or different (far apart) based on the token’s return behavior.
We can observe that most ERC-20 tokens are densely gathered, highlighting the large number of altcoins undergoing the same extensive selling and the obvious lack of special behavior between different sectors.
in other words,Few tokens have escaped this week’s downward volatility, and they are basically all lower together.
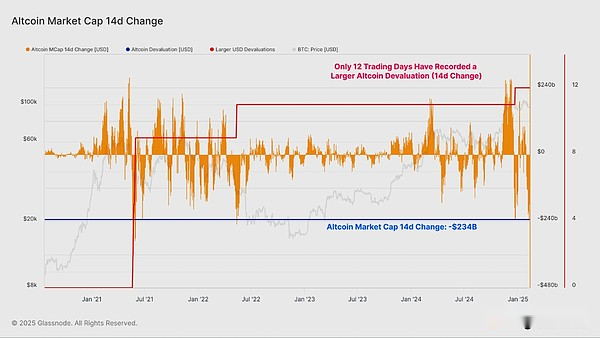
We can assess the decline by evaluating the 14-day changes in the global altcoin market capitalization.Altcoin market value has dropped by $234 billion in the past two weeks, with an absolute decline in a few days even greater.
The severity of this decline highlights the scale of the sell-off incident, which can be reasonably considered to be an event in the bear market in the altcoin field.
This is very interesting becauseBitcoin does not appear to show the same relative weakness, suggesting a disagreement between BTC and other digital asset sectors.
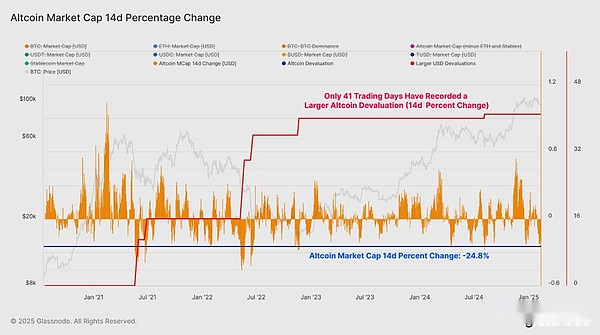
If we look at this indicator in percentage form, the decline in altcoins is still significant, with only 41/1662 trading days falling even more.However, on this relative scale, it does align with the previous downturns experienced throughout 2024.
The current decline is also much smaller than the sell-off in May 2021 (the migration of big miners) and the sell-off at the end of 2022 when the LUNA/UST and 3AC collapses.
Check Bitcoin Loss
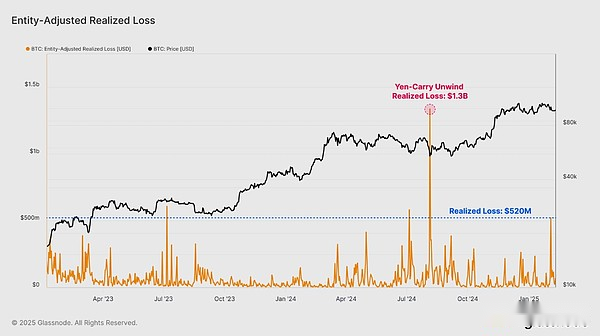
Although Bitcoin prices are relatively stable over the week, the actual losses locked by Bitcoin investors during price fluctuations are one of the biggest losses in the current bull cycle.As the market plummeted to $93,000, investors locked in about $520 million in losses, one of the biggest sell-off events to date.
Therefore, we can regard it as a meaningful sell-off event in the context of the upward trend of the macro bull market.Only the losses locked during the closing of the yen arbitrage trade on August 5, 2023 are the greater single-day losses (actual losses are -1.3 billion US dollars).
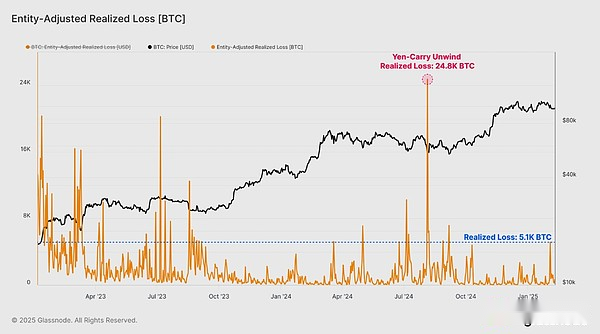
As Bitcoin grows, we must also consider,The absolute measure of actual losses can be misleading compared to previous price ranges.When these losses are evaluated in BTC denominations, this actually normalizes the market size and the severity of losses begins to look more “typical”.
The surge in losses was similar to the local sell-off event before the full year of 2024, suggesting that this could still be considered a normal event in a bull market adjustment/consolidation period.
Analyze the loss
During bull markets, long-term investors are usually lucrative.Therefore, the main source of realized losses is the short-term group of holders, which accounts for the recent investor group with the highest average cost basis.
Usually, there is no loss from long-term holders during a bull market.Losses in the LTH group usually begin with the cycle transition from a bull to a bear market and accelerate as market declines intensify.Finally, it ends with a final rush, usually peaking near the lows of the macro cycle.
Alternatively, short-term holders who are relatively price-sensitive tend to suffer huge losses during the declines in bull and bear markets.The adjusted realized losses of short-term holder entities this week totaled $520 million, similar to the pullback magnitude of the entire 2024-25 cycle so far.
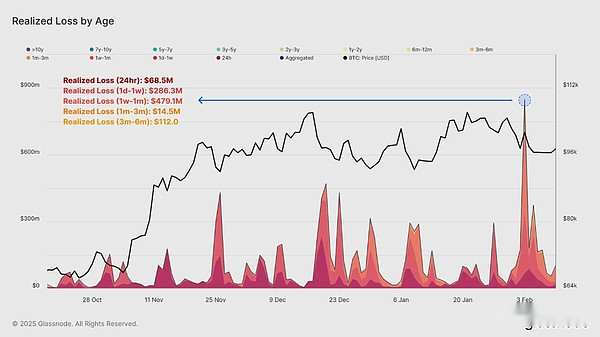
If we further analyze short-term holder losses, we will find that most of the losses are related to investors who have only purchased tokens within the past 1 month.The following are subdivided by currency age:
-
Actual loss in 24 hours: $68.5 million
-
Actual loss from 1 day to 1 week: US$286.3 million
-
Real loss from 1 week to 1 month: $479.1 million
-
Actual loss from 1 month to 3 months: $14.5 million
-
Real loss from 3 months to 6 months: $112 million
This reinforces the idea:Most on-chain volume and realized losses are often associated with investors who have recently entered the market, so they are most sensitive to volatility and price volatility.
Looking to the future
As prices fluctuate, we can use a set of on-chain derived pricing levels to explore some potential paths and thresholds for future prices.
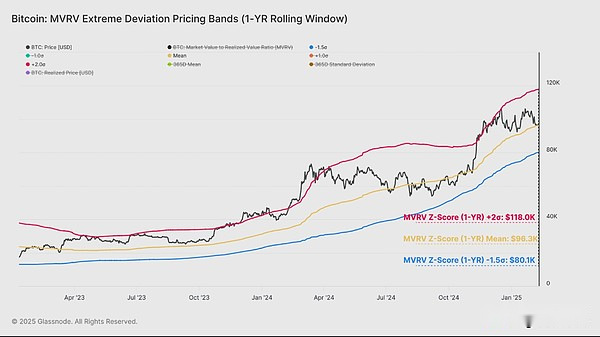
To evaluate key support areas, we can use MVRV Z scores on a 1-year rolling window.This specific transformation can more clearly represent recent market dynamics, and the model captures only recent market behavior.
-
+1σ: $118,000 (red)
-
Average: $96,300 (yellow)
-
-1σ: 80,100 USD (blue)
Currently, prices are receiving strong support near the moving average.If the price falls below the -1σ level, it may become a key threshold for the next major defensive support line for the bulls.Instead, the +1σ level may become a resistance level as investors obtain a large amount of unrealized book profits and may seek to cash out as market power.
Since we have determined that most of the losses come from the short-term holder group, it is wise to emphasize their investment positioning when the market trades around the intermediate MVRV support range.
Historically, the average cost basis for short-term holders has also played a strong support role in the bull market upward trend.The pricing model currently trades at about $922,000, which is a key area for the market to avoid further declines.
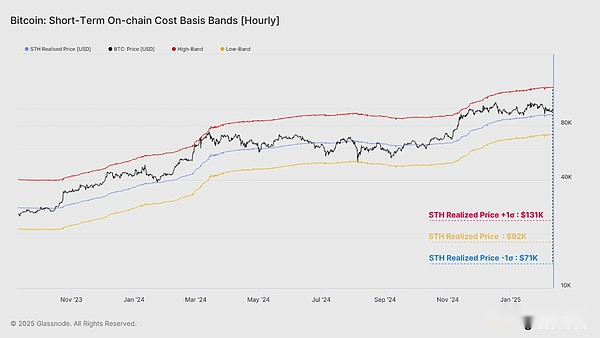
We can similarly use the ±1σ interval based on the complete backtracking Z fraction conversion to evaluate the typical upper and lower limits of price behavior.
-
Short-term holding cost basis +1σ: USD 131,000
-
Short-term holding cost basis -1σ: US$71,000
Currently, spot prices trade between the upper and lower limits and hover over the STH cost basis.This showsThe bulls are still in control, but the price is approaching their first line of defense and have almost tested the STH cost base in the recent sell-off event.
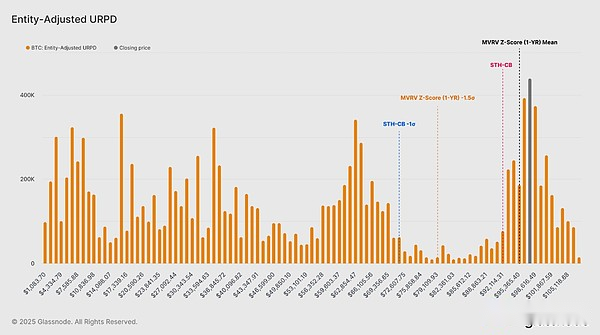
The importance of defending the STH cost base and MVRV 1Yr Z-Score pricing area becomes increasingly obvious when the price trajectory is superimposed on the URPD volume distribution chart.Significant volume voids can be seen below these levels, and few tokens change hands within this price range.
Furthermore, the -1σ band of the STH cost basis is at the upper limit of this volume gap, indicating that if the price drops to this extent, this may be a relatively sensitive area.
Summarize
Bitcoin prices have both fluctuated violently and have stabilized in the past few weeks.It once rose to a high of $105,000 and fell to a low of $93,000, but at the end of the week, the price remained around $98,000.
This unstable price trend has resulted in heavy losses, with a total of US$520 million, denominated in US dollars, and is one of the biggest losses in this cycle.However, when the severity of the decline was assessed by standardized indicators, the sell-off was still roughly consistent with other local adjustments.
In contrast, the altcoin industry has experienced a large-scale sell-off and has failed to gain a foothold.Most tokens have experienced highly correlated downside sell-offs, and few industries have survived.
This led to one of the largest altcoin declines ever, highlighting a clear disconnect between Bitcoin and the typical rotation of capital to altcoin pattern in previous market cycles.