
Author: CryptoVizArt, UkuriaOC, Glassnode; Compilation: Wuzhu, bitchain vision
summary
-
The hash rate is still slightly below all-time highs, and despite the decline in revenue, miners’ continued investments show that they have great confidence in the Bitcoin network.
-
Investor interaction with exchanges is decreasing, and trading volumes are shrinking across the board, indicating a weaker interest in investors and trading.
-
Both Bitcoin and Ethereum ETFs have experienced capital outflows, however, investors’ interest in Bitcoin ETFs is still significantly greater in size and quantity.
miner
Miners remain a basic participant in the Bitcoin network and the main source of production of the new currency.Miners provide hash power for discovering the next valid block, and the network will automatically reward them with newly issued coins and transaction fees.
This makes mining a challenging industry because they can’t control the cost of energy input or output of BTC.
Despite the unstable and uncertain market conditions, Bitcoin miners continue to install new ASIC hardware, driving the overall hash rate higher (14D-MA) to 666.4EH/s, just 1% lower than ATH.
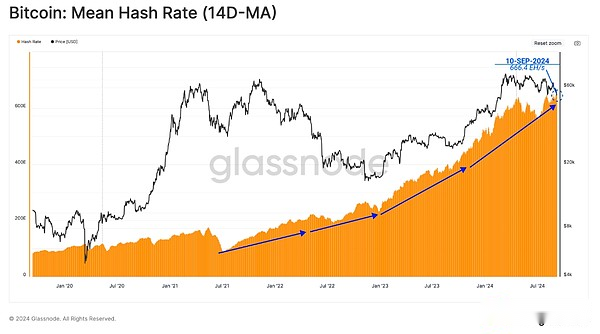
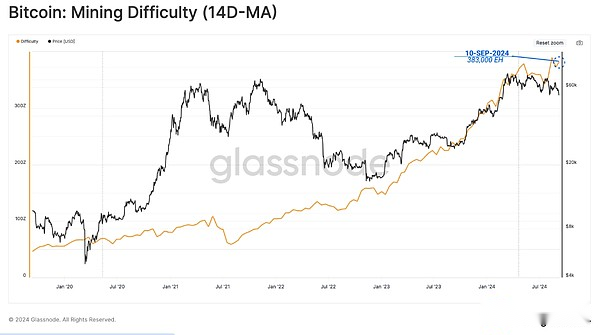
As the hash rate increases, the difficulty of successfully mining effective blocks will also increase.The Bitcoin protocol automatically adjusts the difficulty to adapt to the rise and fall of hash rates on the network.
Currently, the average hash count required to mine a block is 338k exahash.This is the second most difficult part of the Bitcoin life cycle, highlighting the increasingly fierce competitiveness of the mining industry.
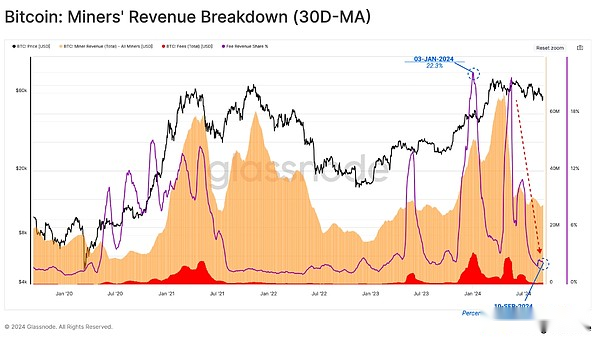
despite this,Miner income has seen a sharp drop since market prices hit a new high in March.A large part of the decline in revenue can be attributed to lower expense pressures.This is due to a decrease in demand for currency transfers and a decrease in fees arising from runes and inscription-related transactions.
With the spot price exceeding $55,000, miners’ income related to block subsidies remains relatively high, but is still around 22% lower than the previous highest price.
-
Collective subsidy income: US$824 million
-
Transaction fee income: US$20 million
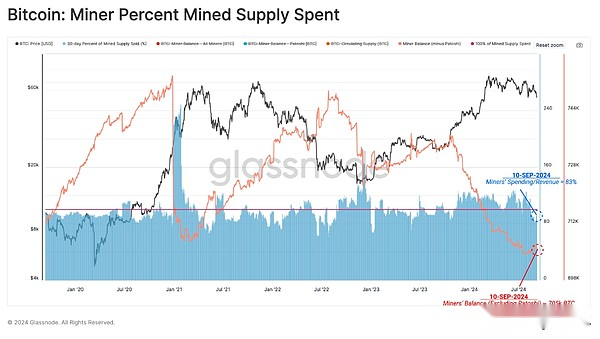
As income falls, we can infer that a certain level of income pressure may begin to emerge.We can estimate the percentage of mining supply miners spend in 30 days to measure whether that is true.
Due to the competitive and capital-intensive nature of the mining industry, miners have traditionally needed to allocate most of the money mined to cover the cost of input.Interestingly, miners have shifted from net allocation of mined supplies to now keeping a portion of the mined supplies in their treasury reserves.
This highlights an interesting development because miners are often pro-cyclical, sellers during downwards and holders during upwards.The rise in hash rate and difficulty represents an increasing cost of production for BTC, which may adversely affect miners’ profitability in the near future.
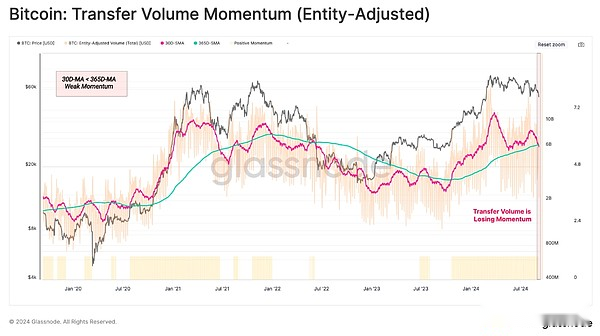
Settlement slows down
The amount of transactions settled on the chain can also reflect the degree of adoption and health of the network.When filtering the adjusted transaction volume of an entity, the network currently processes and settles transaction volumes per day are approximately $6.2 billion.
However,Settlement volumes began to decline to annual averages, indicating a significant decline in network usage and throughput.Generally speaking, this is a net negative observation.
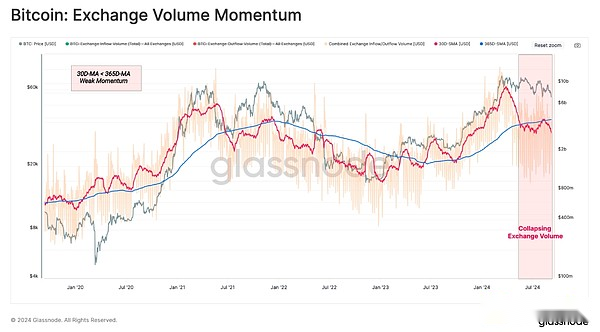
Decline of trading intention
In the ever-changing market structure, centralized exchanges have been the central place for speculative activities and price discovery.Therefore, we can evaluate the on-chain trading volume of these venues as an indicator of investor activity and speculative interest.
A similar 30-day/365-day momentum crossover is made for exchange-related inflows and outflows, and we can see that the monthly average trading volume is much lower than the annual average trading volume.This highlights the decline in investor demand and the decrease in trading among speculators within the current price range.
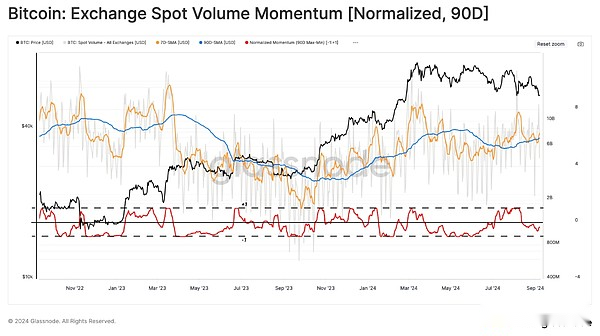
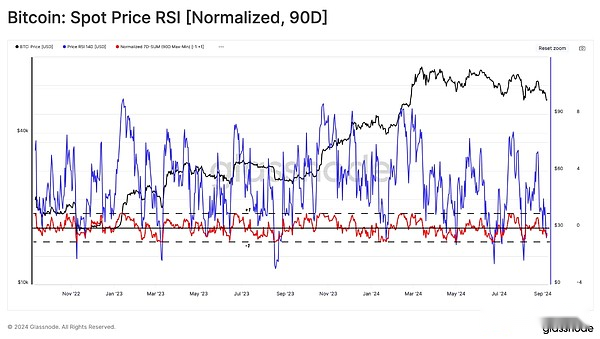
Next, we will study the exchange’s spot trading volume.Here we apply a 90d MinMax scalar that sets the value to a regularized value in the range of 1 to -1 relative to the maximum and minimum values of the selected period.
This can determine similar observations, and the momentum of spot trading volume continues to decline.This further confirms the notion that trade activity has dropped significantly last quarter.
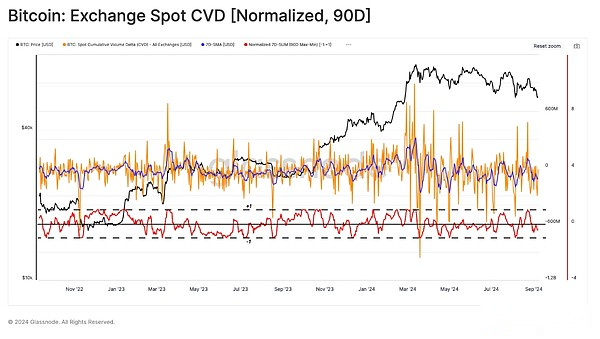
The CVD indicator can estimate the net balance between current buying and selling pressures in the spot market.Using the same approach, we noticed that the selling pressure from investors has been increasing over the past 90 days, causing the price movement to tilt downward.
Finally, we can evaluate the momentum of Bitcoin price.Here we can see a certain degree of indecision, with positive and negative data points appearing in August.This is in sharp contrast to the two indicators emphasized earlier, both of which were significantly negative in the same period.
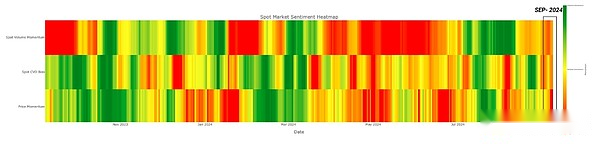
Combining MinMax transformations of volume, CVD and price behavior, we are able to generate a sentiment heatmap about eigenvalues between 1 and -1.We can consider this on the following framework:
-
A value of 1 indicates a high risk (green)
-
A value of 0 indicates moderate risk (yellow)
-
A value of -1 indicates a lower risk (red)
All three indicators indicate thatCompared to the data points over the past 90 days, the market is entering a low-risk zone.This convergence between spot indicators in question can be translated into reduced (spot volume momentum) selling volume (CVD < 0), while price action is slowly declining.This structure may be susceptible to external forces and may explode on either side if the situation changes.
ETF
The Ethereum ETF has now been launched in January following the US Bitcoin ETF in August.These two events mark the “crossing the Rubicon” event of the digital asset ecosystem, providing a convenient entrance to traditional U.S. markets to reach two leading cryptocurrencies.
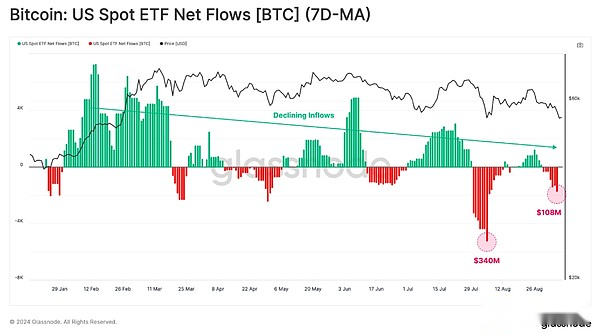
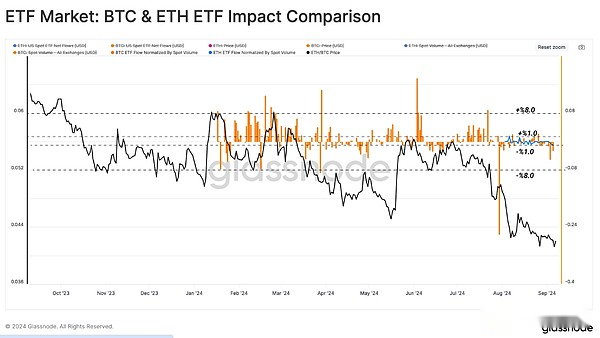
Starting with the Bitcoin ETF, we can see thatNet capital flows in the U.S. dollar have weakened since August 2024, with current reported outflows of $107 million per week.
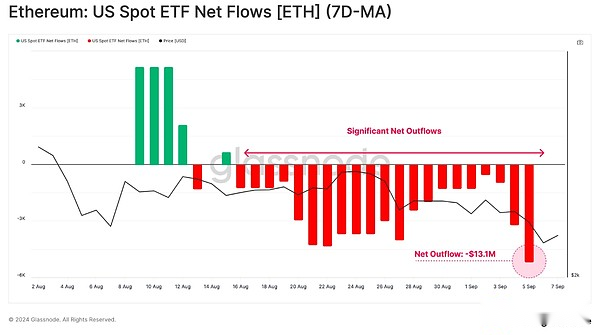
Recently, the demand for Ethereum ETFs has been relatively tepid, with net negative outflows.This is driven primarily by redemption of Grayscale ETHE products, and the inflow demand from other tools is not enough to offset this demand.
Overall,The total outflow of Ethereum ETFs is -13.1 million US dollars.This highlights the difference in demand scale between BTC and ETH, at least under current market conditions.
To approximate the impact of ETFs on Bitcoin and Ethereum markets, we have standardized the net flow deviation of ETFs through the corresponding spot trading volume.This ratio allows us to directly compare the relative weights of ETFs in each market.
As shown in the figure below, the relative impact of ETFs on the Ethereum market is equivalent to ±1% of spot trading volume, while the Bitcoin ETF is ±8%.This shows that despite standardization, interest in Bitcoin ETFs is still an order of magnitude greater than Ethereum ETFs.
Summarize
Miners continue to show great confidence in the Bitcoin network, despite a sharp drop in revenue, the hash rate is still slightly below its all-time high.However,Since miners are often pro-cyclical, sellers during the decline and holders during the rise, if they fall further, it can be expected that the seller will face some level of pressure.
at the same time,Investor interaction with exchanges continues to decline, and trading volumes shrink across the board, indicating a weaker interest in investors and trading.This is also evident in the institutional field, with both Bitcoin and Ethereum ETFs showing net outflows.