Author: Andrew Hong Source: Crypto Data Translation: Shan Ouba, Bitchain Vision World Realm
Each market cycle appears.If you are not familiar with this concept, you can think about the enthusiasm of the R/WallStreetbets community in 2021.A group of people gathered around a certain fan, and in a short time (from a day to a few months), they coaxed the price of a certain asset.From the blockchain layer to the application layer, this has become a popular marketing strategy in the cryptocurrency field -because it can not only increase prices, but also attract people’s attention to the entire ecosystem.Some projects, such as Avalanche, even set up official funds for Magnitile Coins.
The boundaries between mystery and other tokens are sometimes blurred, but the universal consensus here is that there is no value that supports these tokens except the obedience itself.For example, the Doge as the tokens is actually only supported by Shiba Inu dogs.This is different from the ETH tokens that guarantee the Ethereum as a security guarantee, the UNI token with the entire Uniswap protocol as the backing, or the MKR token with a complete mortgage stable coin service.
Farcaster Lost Coin (such as Degen) is the latest popular type, and its main advantage is that social functions are open accessible.Therefore, I want to test some basic analysis combined with social and financial data to test water.
Social and financial indicators to measure mystery
I initially assumed that we could compare the social and financial health of all the coins through a simple chart:
>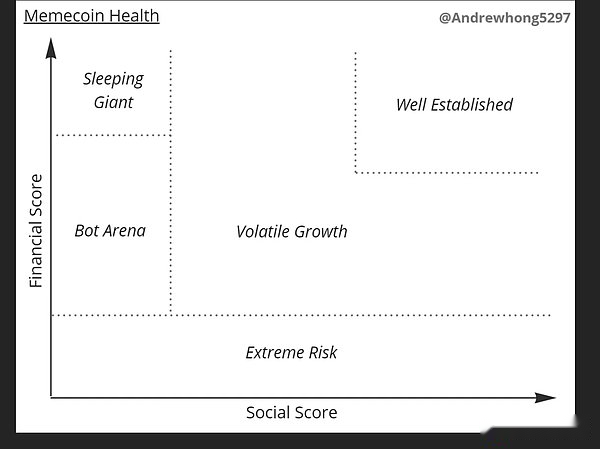
In the chart, I divide the mystery of five main areas:
Extreme risk: The risk of liquidity and low transaction volume is very high, and rugged scams are prone to appear (because there may be only a few liquidity providers)
Robotic battlefield: Most fans can never get out of the battlefield because of coins, thousands of currencies (many of the same token name/variant) are competing for social and financial concerns
Volatility increase: Breaking through the initial circle, the centers need to maintain its momentum and growth now.You may see a substantial fluctuation of 100-500% of the price in a few days, and there will be a group of influential people who start to pursue this mystery.
High popularity: Leaders will maintain a leading position in terms of social and finance, and it is obviously different from other projects.Weekly data fluctuations may be smaller. As people’s inflow and outflow reach balance, attention will continue.
Sleeping giant: Both social and finance have obtained a lot of growth (and no carpet scams), which may be silent for a while, in this corner.The project party may have established a DAO organization, starting to provide some randomly cast tokens or products, and strive to maintain the operation of the community.At the same time, they also hope to attract attention again.
Most of the mini currency should be stuck in the “robot battlefield” stage. A few attractive projects will enter the “volatility growth” stage. Perhaps only one or two projects can reach the level of “high popularity”.In the process, some projects may lose their social influence and become “sleeping giants”. Other projects may lose financial support (liquidity) and become “extreme risks.”
I believe that the success of successful coins usually go through this process:
>
You may see many mini coins that push social scores through robots or celebrities but lack financial support (liquidity). Such projects are often reduced to scams.
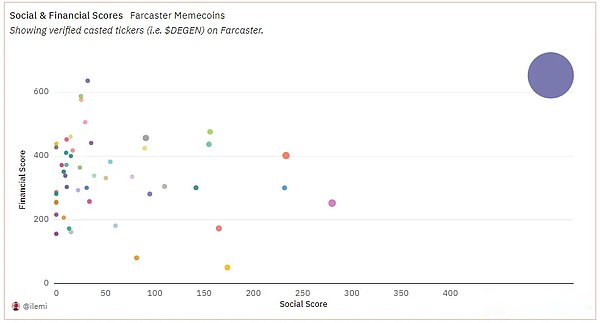
After a large amount of data compilation and cleaning, I made this chart, focusing on Farcaster Lost Coins:
>
Analysis results meet the expectations
The result of this chart is indeed the same as I expected. Degen is far ahead in the upper right corner, and then several projects such as ENJOY, Higher, TN100X, and Every are located in the middle area.All other items are gathered on the left to compete for attention and liquidity.
It is worth noting that I did not filter out the false accounts/robots here, so the social scores of some mini coins may be distorted.This will become the direction of future improvement!
Now, let us start an reverse analysis from the final chart to explain how these two scores are produced.For those who want to study more in -depth research, I will also raise further research questions and explain in detail my inquiries.
>Dune’s instrument panelLinks are here, and some charts are not included in this article.
Social score
Each score is composed of the “foundation” part and the “growth” part.For social scores, we first measured the release and participation mentioned in the tokens.Therefore, according to this method, “$ Degen” will be included, and only “Degen” will not.
This provides us with five main columns:
-
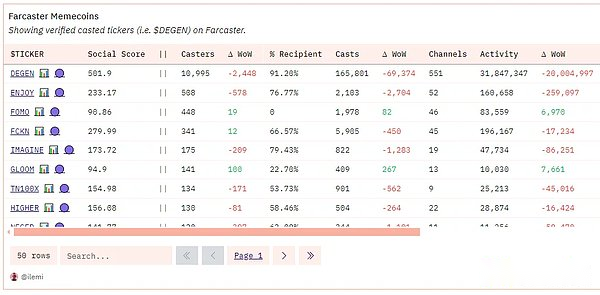
Publisher: The number of people who have published a given token symbol
-
Proportion of receivers: The proportion of people who have received the token in the publisher
-
Number of releases: Including the number of releases of the given inspection symbol
-
Channel: Including the number of channels published by the given giving symbol
-
Activity: Participation (like + reply) plus the number of publishers multiplied by the publisher cubic root and then multiplied by the channel cubic root
The total social score is calculated from the following parts: the “foundation” part is activity, and the “growth” part is the multiplication of the unique publisher and receiver publisher.The idea here is that if you see the number of people published to the tokens and the number of people who buy/obtain to tokens, this is a very healthy sign.
Overall, it looks like this in the form:
>
Financial score
Here are the main financial indicators:
-
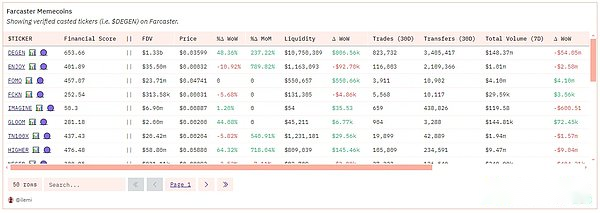
Complete diluted value (FDV): Total supply multiplied by price
-
Price: The latest price based on DEX transaction
-
Daily/week/monthly price change percentage: daily, weekly and monthly price change percentage percentage
-
Liquidity: This is non-token liquidity, which means that for a Degen-Weth pool, we only calculate the WETH part.It can more stablely show how good the good liquidity of the tokens is.
-
Transaction: DEX trading times in the past 30 days
-
Transfer: ERC20 transfer times in the past 30 days
-
Total transaction volume: DEX trading in the past 7 days
The “foundation” part of the financial score is non -token liquidity and DEX transaction volume, and its “growth” part changes based on liquidity.
Overall, it looks like this in the form:
>
Further research direction
Here are some questions I hope to see everyone in depth:
-
How to score a false account/robot for publishers?Can it be weighted according to the value of the tokens in the wallet?Can the publisher be classified according to the relationship between the publisher and the known group and/or community personnel?
-
Classify the wave of social and financial growth -How is they related?Is there a delayed time or one -way dependence?
-
Is it a person who promotes the initial growth wave?What are the people who joins, add and miss the cause of the early days?Is there a relationship between user levels?
-
What will happen when one fan is from one “rotation” to another?What or who promoted this?
-
Does a person’s social or financial interests determine his “interest” of his/she’s “interest”?人们在购买/出售代币后发布的次数会增加还是减少?
-
一个迷因的平均生命周期是多少?在社交和财务方面分别是怎么样的?