Source: CryptoVizArt, UkuriaOC, Glassnode; Compilation: Whitewater, Bitchain Vision
summary
-
Strong capital inflows in ETFs and spot markets drove Bitcoin to $93,000.More than $62.9 billion has entered the market in the past 30 days, with BTC dominating demand inflows.
-
The unrealized increase in long-term holders has triggered large-scale spending activity, with 128,000 bitcoins sold between October 8 and November 13.
-
US spot ETFs played a key role, absorbing about 90% of selling pressure from long-term holders during the analysis period.This highlights the growing importance of ETFs in maintaining liquidity and stabilizing the market.
Capital inflows surge
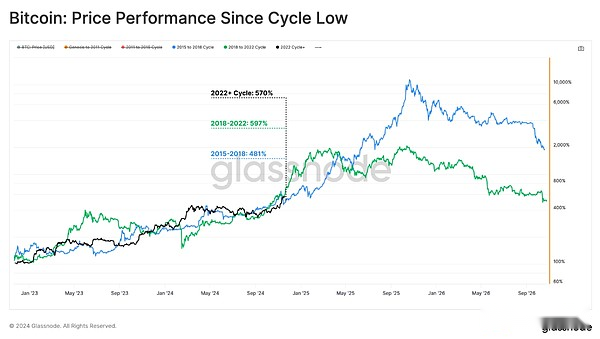
Bitcoin has performed very well since early November, with new ATHs continually forming throughout the month.A surprisingly persistent similarity can be seen when comparing the price performance of the current cycle with the 2015-2018 (blue) and 2018-2022 (green) cycles.Despite the wide variation in market conditions, the magnitude and duration of the rebound are surprisingly consistent.
This long-term consistency across cycles is still interesting, providing insights into Bitcoin’s macro-price behavior and cyclical market structure.
Historically, past bull markets lasted 4 to 11 months from the current point, providing a historical framework for evaluating cycle duration and momentum.
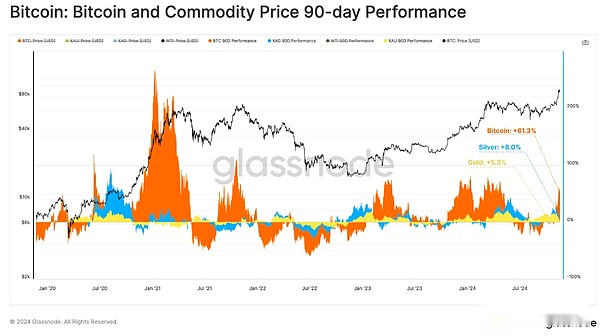
The new ATH was set at $93,200 this week, which brought Bitcoin’s quarterly performance to an impressive +61.3%.This is an order of magnitude higher than the relative performance of gold and silver, with quarterly gains of +5.3% and +8.0% respectively.
This sharp contrast shows thatCapital may shift from traditional value asset commodity storage to a younger, emerging and digital asset like Bitcoin.
Bitcoin’s market value has also expanded to an astonishing $1.796 trillion, becoming the seventh largest asset in the world.The move places Bitcoin on top of two symbolic global assets: $1.763 trillion worth of silver and $1.791 trillion worth of Saudi Aramco.
As of now, Bitcoin is only 20% behind Amazon, making it the next important milestone for its most valuable assets in the world.
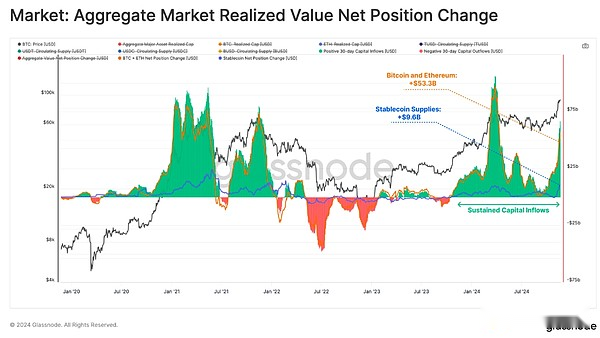
After Bitcoin’s outstanding performance in 90 days, the wider digital asset market began to experience a large influx of funds.In the past 30 days, total inflows have reached $62.9 billion, of which the Bitcoin and Ethereum networks have absorbed $53.3 billion, while the supply of stablecoins has increased by $9.6 billion.
This is the highest level since its peak in March 2024, reflecting the recovery of confidence and new demand after the U.S. presidential election.
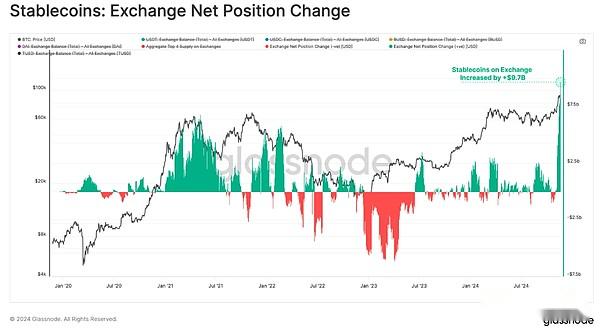
Expand the observed capital inflows, with the vast majority of the $9.7 billion stablecoins minted in the past 30 days deployed directly to centralized exchanges.This inflow is closely related to the total capital flow of stablecoin assets during the same period, highlighting its key role in stimulating market activity.
ExchangeThe surge in stablecoin balances reflects strong speculative demand from investors exploiting the trend, further strengthening the bullish narrative and post-election momentum.
Investigate the profitability of investors
So far, we have explored the trend of rising market liquidity, which supports Bitcoin’s excellent performance.In the next section, we will use the MVRV ratio to evaluate how this price action affects the unrealized profitability (book income) of market investors.
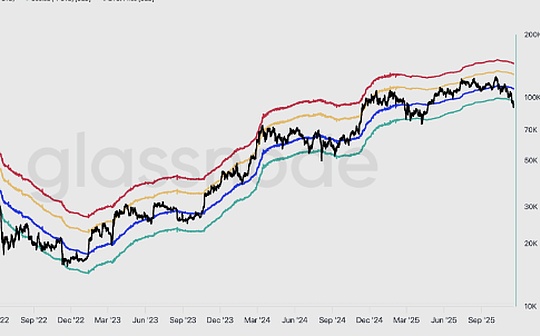
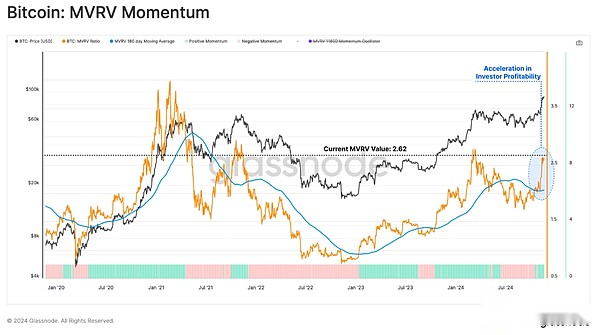
When comparing the current value of the MVRV ratio (orange) with its annual moving average (blue), we can see an accelerated growth in investor profitability.This phenomenon is often a support environment for the continued momentum of the market, but also creates conditions in which investors are more likely to start profit settlement to achieve book returns.
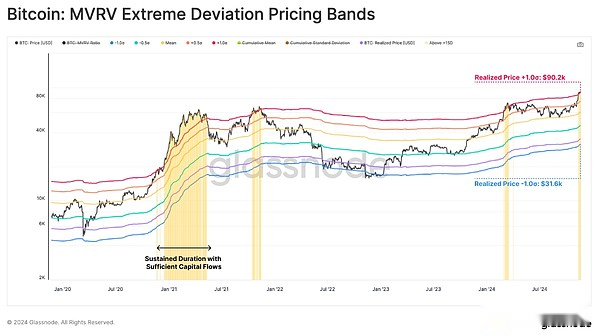
As market investors improve profitability, the potential for new seller pressure will increase.By superimposing the MVRV ratio with the ±1 standard deviation band, we can construct a framework to evaluate the market conditions of overheating and overheating.
-
Overheating (warm color): MVRV trading above +1SD
-
Inadequate heating (cool color): MVRV transaction is below -1SD
The price of Bitcoin has recently broken the +1σ range, or $89,500.This suggests that investors currently hold statistically significant unrealized profits and indicates an increased likelihood of profit-taking activity.
However, the market has been in this overheating state for a long time for historically, especially supported by large enough capital inflows to absorb pressure on the seller.
Extreme expenditures for long-term holders
During the thriving phase of the market cycle, the behavior of long-term investors becomes crucial.LTH controls a large portion of the supply, and its spending dynamics can greatly affect market stability, ultimately forming a local and global top.
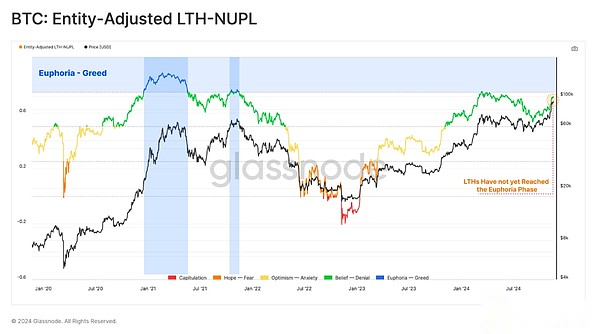
We can use the NUPL indicator to evaluate book earnings held by LTH, which is currently 0.72, slightly below the threshold of belief (green) to excitement (blue).Despite the sharp rise in prices, these investors’ sentiment remains lower compared to the previous cycle tops, indicating that there may be room for further growth.
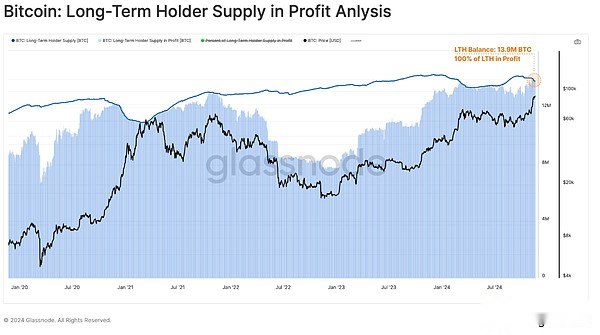
As Bitcoin breaks through $75,600, the 14 million Bitcoin held by long-term holders is converted into profits, which stimulates the acceleration of spending.This has caused a decrease in balance +200k BTC since the ATH breakout.
This is a classic and repetitive model where long-term holders start to take profits as long as the price moves strong and demand is sufficient to absorb profits.Since LTH still holds a large amount of Bitcoin, it is likely that many LTHs are waiting for a higher price before releasing more Bitcoin back into circulation.
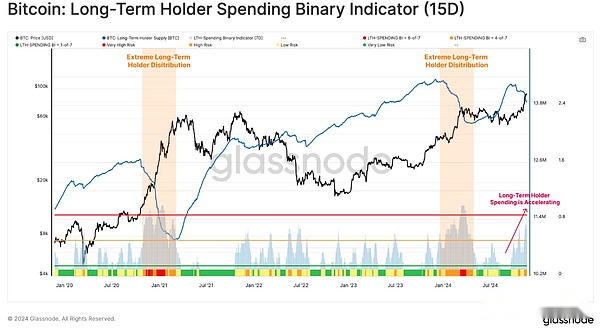
We can use the long-term holder spending binary metric to evaluate the intensity of LTH seller pressure.The tool evaluates the percentage of days spent in the past two weeks that group spends more than they accumulate, resulting in a net decline in holdings.
Long-term holder spending has steadily increased since early September as Bitcoin prices rise.With the recent surge to $93,000, the metric hit a value indicating a decline in LTH balances in 11 of the past 15 days.
This highlights the increase in allocation pressure for long-term holders, although not yet reached the extent observed around the March 2021 and March 2024 peaks.
After identifying the increased spending behavior of long-term holders, we can consult the next tool to gain a deeper understanding of their activities around key market points.The interaction of profit-taking and unrealized profits helps highlight their role in shaping cycle transitions.
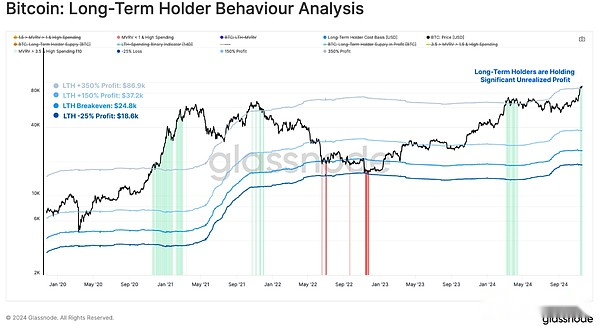
The graph visually shows:
-
LTH Achieved Price (Blue): The average acquisition price for long-term holders.
-
Profit/loss pricing range (blue): Ranges representing the extreme profit (+150%, +350%) and loss (-25%) levels, usually triggering significant spending activity.
-
Profit-taking (green): The stage in which long-term holders hold more than 350% of profits and increase spending.
-
Selling (red): Long-term holders are in a high spending period of -25%+ loss.
Bitcoin’s price has soared to more than 350% profit range (at $87,000), prompting this group to experience significant profit-taking.As the market rises, distribution pressures may increase, and these unrealized gains will also expand accordingly.That is to say, this marks the beginning of the most extreme stage of the previous bull market in history, unrealized profits grew to more than 800% in the 2021 cycle.
Institutional buyer
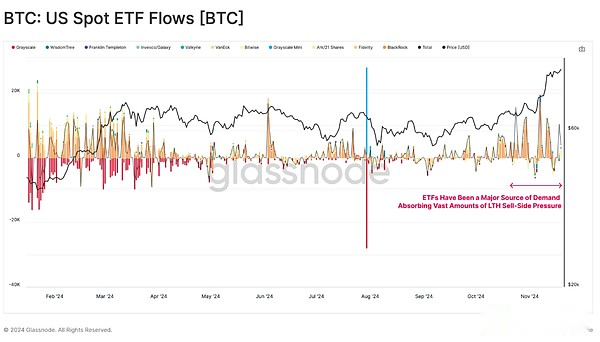
Now we will turn our attention to the role of institutional buyers in the market, especially through US spot ETFs.ETFs have been a major source of demand in recent weeks, absorbing most of the sellers of LTH.This dynamic also highlights the growing influence of institutional demand in shaping the modern Bitcoin market structure.
Weekly ETF inflows have soared to $1 billion to $2 billion per week since mid-October.This represents a significant increase in institutional demand and is one of the most significant periods of capital inflows so far.
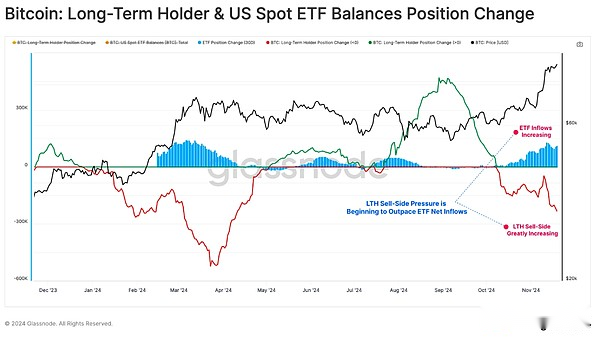
To visualize the balance of LTH selling pressure and ETF demand, we can analyze the 30-day changes in Bitcoin balance for each group.
The chart below shows that between October 8 and November 13, the ETF absorbed approximately 128,000 BTC, accounting for about 93% of the net selling pressure of 137,000 BTC applied by LTH.This highlights the key role of ETFs in stabilizing the market during the period of increased selling activity.
However, since November 13, LTH seller pressure began to outstrip net ETF inflows, echoing the pattern observed in late February 2024, when supply and demand imbalances resulted in increased market volatility and consolidation.
Summarize
Bitcoin rose to $93,000, backed by strong capital inflows,Capital worth approximately $62.9 billion in the past 30 days has flowed into the digital asset space.This demand is led by institutional investors through U.S. spot ETFs, even as capital flows out of gold and silver.
ETFs play a key role, absorbing over 90% of sell-side pressure from long-term holders.However, as unrealized profits reach more extreme levels, we can expect LTH spending to increase and its inflows will exceed ETF inflows in the short term.