Author: LTP Research
Binance’s liquidity performance remains the leading position in the 0.1% price range only.Once the price range exceeds 0.3%, Binance’s Bitcoin transactions become more volatile to liquidity, while Kraken’s liquidity performs relatively high.
Introducing LTP liquidity score: a liquidity calculation method based on order book depth as an indicator
Report summary
In the trading world, liquidity issues are crucial to any type of investor, trader, or exchange.This report aims to introduce and analyze the liquidity changes of various currencies in centralized cryptocurrency exchanges based on the in-depth data of the order book, and then derive the trend of changes in the overall liquidity of the exchange for investors’ reference.
As the leading master brokerage service provider in the cryptocurrency industry, LTP uses an independent liquidity scoring method to comprehensively evaluate the liquidity performance of exchanges.By comparing order book depth data for more than 13 cryptocurrency pairs in 12 mainstream exchanges for more than 6 months, this report draws the following main conclusions:
-
The top four exchanges with the best liquidity are Binance, Kraken, Coinbase and OKX, and their sorting can remain relatively stable during observations over 6 months.
-
Since March 2024, Gate and KuCoin’s liquidity performance has gradually increased.Bitfinex’s liquidity shows high volatility.
-
Bitcoin liquidity performance: Binance’s liquidity performance remains the leading position in the price range of only 0.1%.Once the price range exceeds 0.3%, Binance’s Bitcoin trading becomes more volatile to liquidity, while Kraken’s liquidity performs relatively high.
-
Ethereum liquidity performance: Compared to Bitcoin, Ethereum’s liquidity on all exchanges is more volatile across five price range levels.In contrast, Binance’s Ethereum liquidity score becomes more stable only when the price range exceeds 0.3%.
By observing the LTP liquidity index, from January to June 2024, the overall LLI liquidity index in the market has steadily risen and five liquidity peaks have occurred.The first three happened in March, when Bitcoin prices broke through their previous highs, and the last two occurred in early June.
Brief description of the concept of liquidity
What does liquidity in finance mean?
In financial markets, liquidity refers to the difficulty of an asset or securities converting into cash without having a significant impact on its price.
in“Without having a significant impact on its price”mean:
-
The less impact a transaction has on market prices, the higher the liquidity of the asset is.
The greater the impact of a transaction on market prices, the lower the liquidity of an asset.
Give an example:
-
Situation One: Alice purchased $100,000 in Asset A, which caused a price increase of 1%.
Situation 2: Bob’s purchase of $100,000 in asset B caused a 2% increase in price.
In the above two cases, it can be seen that Asset A is more liquid than Asset B.Because the price of asset A increases less for the same investment amount, this indicates that the amount of investment has a smaller impact on the market price and therefore has better liquidity.
and“It’s easy to convert to cash”It means:
-
The easier the process of converting assets into cash, the better the liquidity of assets will be.
The harder the process of converting assets into cash, the worse the liquidity of assets will be.
For example, generally speaking:
-
Gold is easier to sell into legal tenders in various countries than real estate, which means gold can be converted into cash more quickly and easily.
Therefore, gold is liquid better than real estate.
Crypto exchange liquidity
Liquidity of centralized exchanges (CEX)
Source: binance.com
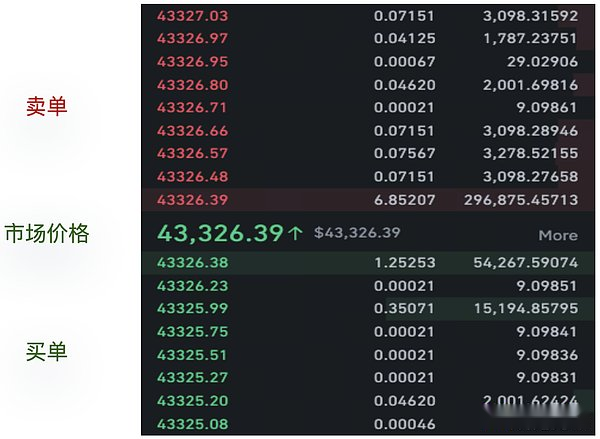
In the crypto industry, almost every centralized exchange uses an order book to list all the orders that are being hung.
Generally speaking, the more buy and sell orders included in the order book, the better the liquidity of the trading assets will be.
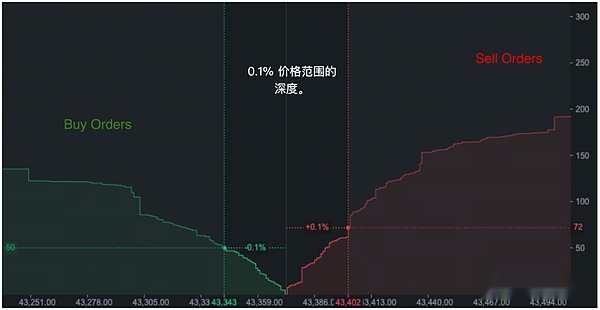
Source: binance.com
The above image is a snapshot of the depth view of the Bitcoin Order Book.On the left is the seller’s order, and on the right is the seller’s order. Investors can view the total number of Bitcoins that buyers and sellers can take orders within a specific price range.As shown in the chart, the 0.1% price range shows that 50 and 72 bitcoins are available for buyers and sellers, respectively.
By comparing the depth of the order book, whether in bitcoin quantity or in dollar terms, investors can identify which exchange provides the best liquidity.
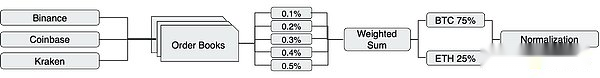
Schematic diagram of liquidity score calculation methodology
Liquidity of decentralized exchanges (DEX)
Decentralized exchanges (DEXs) rely on a trading mechanism called automatic market makers (AMMs) as the pillar protocol and basis for liquidity in the decentralized finance (DeFi) track.
Due to the limited settlement speed of Ethereum, most DEXs operate without relying on traditional buying and selling orders, so there is no need for an order book, which is different from traditional exchanges.DEX traders directly trade with a liquidity pool composed of two tokens*.The price of each token in the pool is determined by a fixed mathematical formula.The most classic DEX Uniswap uses the formula of a constant product: x * y = k, that is, in the absence of new liquidity, no matter how the user trades, the product of the two currencies in the pool remains unchanged.
In DEX, there is a liquidity provider (i.e., LP) role that is specifically responsible for providing two currencies in the pool for transactions, thereby earning handling fees.As the popularity of the currency increases, more incentives for LP will be given, and more tokens will be added to the pool, and the total locked TVL will also increase, and the liquidity of the pool will increase.
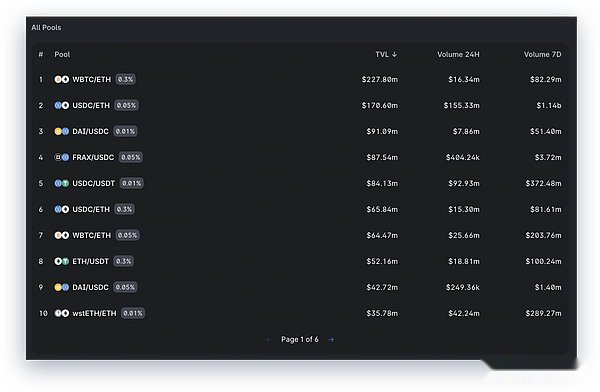
Source: https://info.uniswap.org/
Tokens with higher total locked value (TVL) in liquidity pools have better liquidity in decentralized exchanges.
LTP liquidity score
What is LTP liquidity score
In order to solve the problem that the transaction volume cannot accurately reflect liquidity due to exchange volume swiping, LTP independently developed a novel exchange ranking method, which relies entirely on the analysis of objective order book data without considering subjectiveor other disorderly factors.Order Book data provides valuable insights into exchange trading activities, market depth and participant behavior.This alternative ranking method is not to replace existing volume-based rankings, but as a supplementary tool.By examining order book data, we can better understand the liquidity differences between different exchanges and use liquidity as an indicator to evaluate exchange performance.In the following report, we try:
-
Explain the method used to calculate liquidity scores.
-
Compare the liquidity level of 12 centralized exchanges.
-
Analyze liquidity data for mainstream high-volume tokens.
-
Introduce and explain what the LTP liquidity index is.
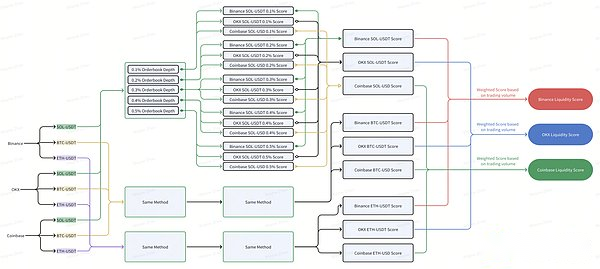
How are exchange liquidity scores calculated?
-
Collect order book snapshot data: Obtain order book data for the same base token trading pairs on different exchanges.For example, BTCUSDT from Binance, BTC-USD from Coinbase, XBTUSD from Kraken, and tBTCUSD from Bitfinex.These data will include the buy and sell prices and corresponding quantities at each price level.
-
Calculate the depth of the price range: Determines the depth of the order book at a specific price range level.For example, calculate the depth of the 0.1%, 0.2%, 0.3%, 0.4%, and 0.5% price ranges.This requires summing the order quantity within a specific proportion of the market price.
-
Calculate the liquidity score for each trading pair: Compare the depth of different trading pairs in each price range.Calculate the liquidity score of each trading pair based on the relative depth.The greater the depth, the higher the liquidity score.
-
Summary Liquidity Score: Consolidate the liquidity scores obtained by each trading pair over different price ranges (e.g., 0.1% to 0.5%).The weighted average score is calculated by assigning appropriate weights to the price range and liquidity at each level.
-
Calculate liquidity scores for trading pairs in multiple currencies: Extend the same method to calculate liquidity scores for more trading pairs and different base tokens.Collect order book data for the required transaction pairs and repeat steps 2 to 4.
-
Calculate liquidity scores per exchange: Finally, the total liquidity score of the exchange is calculated by summarizing all the different trading pairs on each exchange.Weighted liquidity scores based on the 24-hour volume of each trading pair.Trading pairs with larger trading volumes will have a greater impact on the overall exchange liquidity score.
On the next page, we show the above process through schematic diagrams.If you are interested in detailed instructions, please visit: Exchange Liquidity Ranking Methodology.
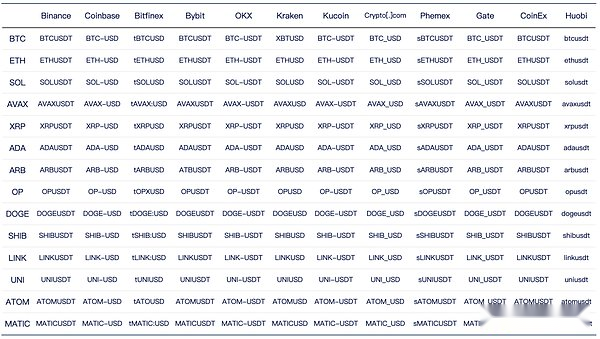
Choice of currency and trading pairs
For spot trading, an exchange provides trading options for multiple currencies, and for the same base currency, it generally provides trading options for multiple quote currency.Therefore, the liquidity of an exchange is very fragmented.
To analyze the liquidity of an exchange more realistically, we first check the trading pairs with the best liquidity.
Ideally, all trading pairs should be considered, but due to specific restrictions, we choose limited trading pairs that account for more than 70% of the total trading volume.
When performing exchange comparisons, we target trading pairs with the same base coins (e.g., BTC-USDT vs. BTC-USD).
We first analyze the order book data of the selected trading pair.The ratings of trading pairs are calculated by comparing different trading pairs with the same base currency within the same exchange.
The total liquidity score of an exchange is based on the transaction pair score weighted by trading volume.
Exchange liquidity ranking
Exchange liquidity score
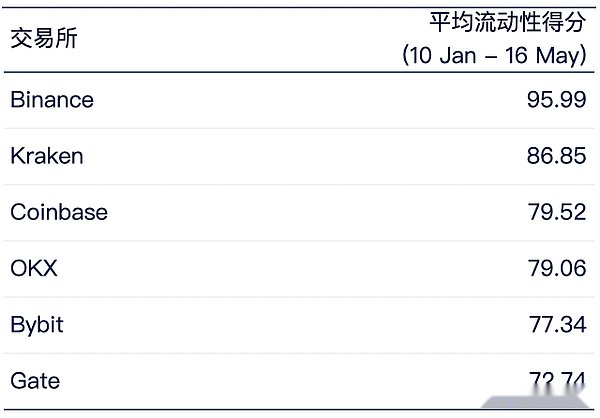
As the world’s largest centralized crypto exchange, Binance Binance remains the most liquid market. In the past six months, the average liquidity score has been 95.99, and only saw significant fluctuations in early March.Next is Kraken, which now ranks second in liquidity rankings with an average score of 86.85.
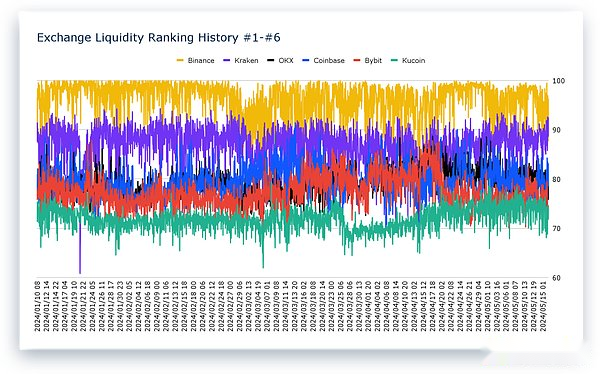
The top four exchanges with the best liquidity are Binance, Kraken, Coinbase and OKX, and their rankings vary relatively stably over time.
Source: LTP Research
Source: LTP Research
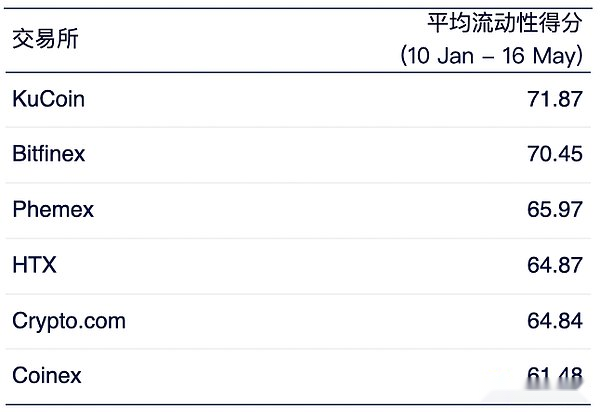
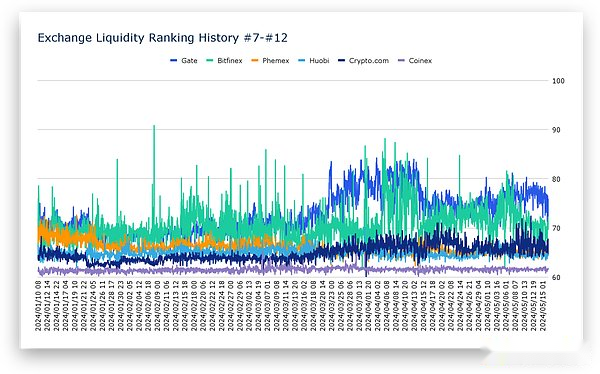
Of the remaining 6 exchanges, Gate.io currently ranks 7th with an average score of 71.87.Gate.io’s liquidity score trend rose significantly after March 20, once more than 80 points, and fell back after a month.Following closely behind is Bitfinex, which has the highest volatility of all exchanges.
Judging from the trend, the liquidity performance of Gate and KuCoin has gradually improved since March 2024.There was no significant change in Phemex, Huobi, Crypto.com and Coinex.
Source: LTP Research
Source: LTP Research
Liquidity of currency
Bitcoin liquidity
Source: LTP Research
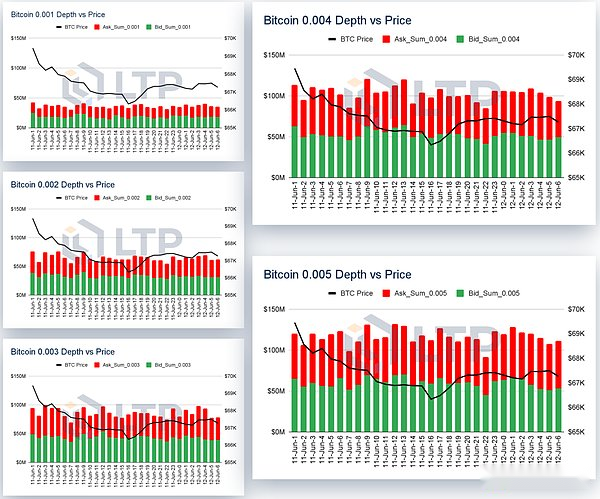
By summarizing Bitcoin order books from 12 centralized exchanges and classifying them into pay and sell orders, we observed Bitcoin’s order book depth performance in five price ranges of 0.1% to 0.5%.
To amplify the granularity, we selected the depth change data of Bitcoin within 30 hours between June 11 and 12, 2024.
It is not difficult to see that the average Bitcoin depth is no more than $50 million in the 0.1% price range.At the 0.3% level, it only hit $100 million.There is little difference between the 0.4% and 0.5% intervals.
Liquidity rankings of each exchange in the Bitcoin market
Source: LTP Research
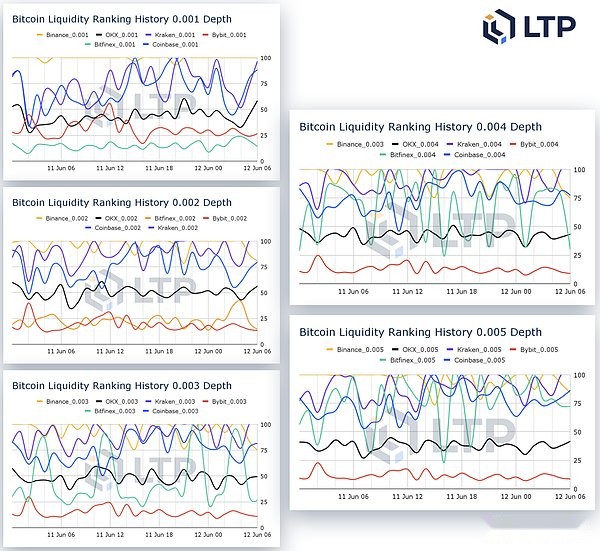
Binance is the most liquid exchange among Bitcoin trading orders.Especially near order books that are very close to market prices, Binance’s liquidity performance is very stable and always ranks first.From this perspective, for retail traders, at Binance, it is always possible to complete orders at the best price.
However, Binance’s advantage is not that obvious when considering orders that are far from the market price.In the price range of hundreds of points, OKX and Kraken often occupy the first place.
Kraken can stay first for most of the time when the price range expands to 0.4%.In such a price range, Kraken can rank first, which is mainly closely related to its ability to provide free Bitcoin transaction fees.
Liquidity of Ethereum
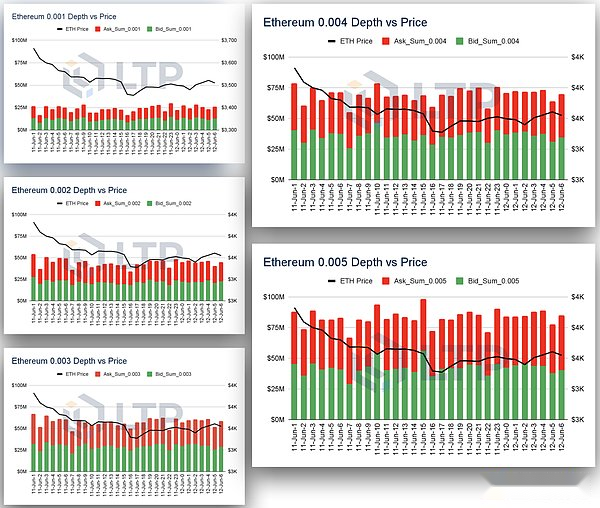
Source: LTP Research
Similar to Bitcoin, the data on the left intercepts the depth changes of Ethereum ETH within 30 hours from June 11 to 12, 2024.
The depth distribution of non-ETH is more concentrated at the level of 0.3% to 0.4%.At 0.1%, depth is below $25 million; at 0.3%, depth is above $50 million; at 0.4%, depth is above $75 million.However, there was no significant increase at the 0.5% level.
According to data during this period, Ethereum ETH’s pay orders and sell orders always maintain a 1:1 ratio.
Liquidity rankings for each exchange in the Ethereum market
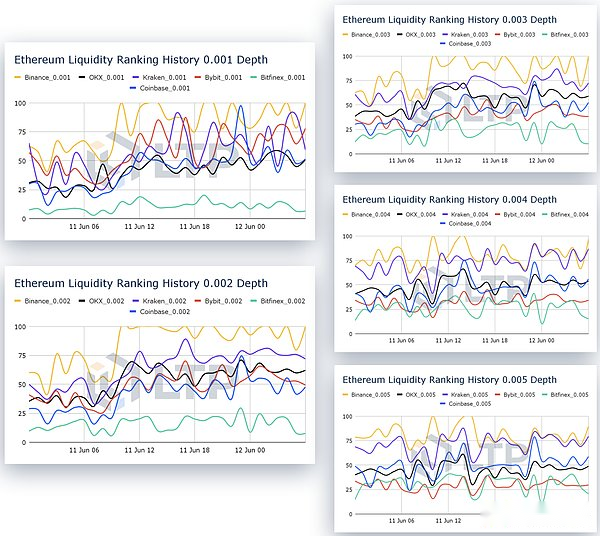
Source: LTP Research
The liquidity change in Ethereum ETH is more volatile than BTC among the 12 exchanges.Although Binance still ranks first, its score has fluctuated by more than 50% over the 30-hour interval observed.
Especially in the early hours of June 11, Ethereum ETH liquidity scores no more than 75 points in all other ranges except the 0.5% price range.It wasn’t until after 6 a.m. that Binance and other exchanges showed improvement.
OKX and Bybit have the potential to catch up with Binance in Ethereum ETH liquidity performance.Especially in the 0.1% price range, their liquidity score is very close to Binance.
LTP Liquidity Index LLI
What is the LTP liquidity index?
The LTP liquidity index is an indicator to measure the overall liquidity of the cryptocurrency market, and comes from the in-depth data of BTC and ETH weighted order book of the three centralized exchanges, Binance, Coinbase and Kraken.It intuitively helps investors understand how overall market liquidity changes over time and BTC prices.Next, let’s take a look at the basic principles of LTP liquidity index.
How to calculate the LTP Liquidity Index (LLI)?
-
We extracted buy and sell order depth data from Binance, Coinbase, and Kraken’s BTC order books and divided the depth into five price ranges, from 0.1% to 0.5%.Next, we calculate the total depth of each price range.
-
We then assign weights to each price range: 0.1% is 30%, 0.2% is 25%, 0.3% is 20%, 0.4% is 15%, and 0.5% is 10%.
-
We use these weights to calculate the weighted depth of each exchange price range in days.Then, we add the weighted depths of the three exchanges to obtain the daily weighted depth of BTC.
-
We set the depth data for the start date to the base value of 1,000.By comparing the remaining depth data with the starting day data, changing from 1,000 points based on its percentage as a reference, we obtain the BTC liquidity index.
-
Using the same method, we calculate the liquidity index of ETH.Next, we combine the BTC liquidity index and the ETH liquidity index, which accounts for 75% of the weight and ETH has 25% of the weight, thus obtaining the LTP liquidity index.
-
Currently, the LTP liquidity index only introduces two mainstream crypto assets, BTC and ETH, as targets. In the future, more Crypto targets will be introduced based on market value, and will be equipped with corresponding weights.
LTP Liquidity Index (LLI)
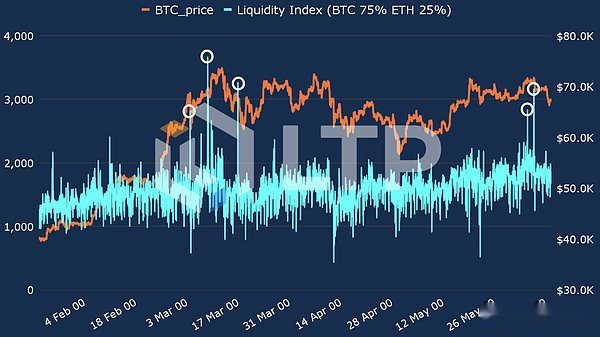
Source: LTP Research
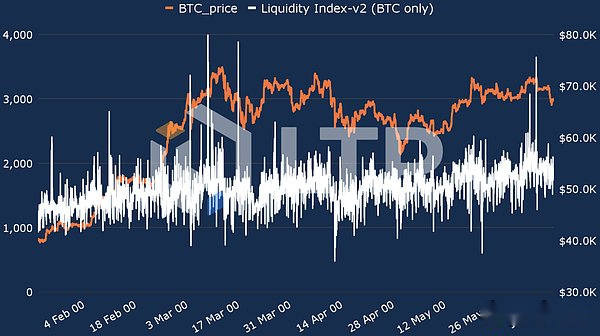
The upper chart is based on hourly changes, clearly showing the relationship between the LTP Liquidity Index (LLI) and Bitcoin price from January 2024 to mid-June 2024.
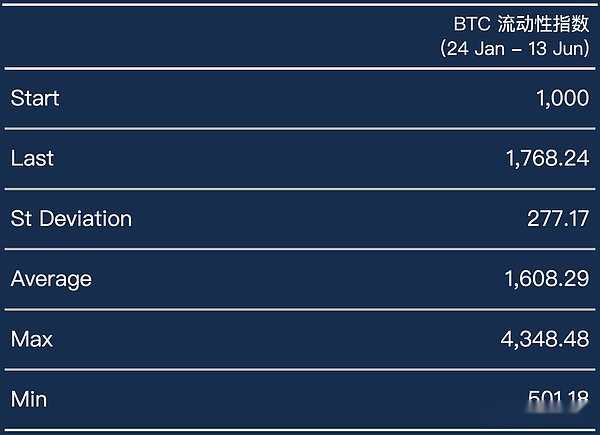
As can be seen from the chart, the liquidity index has gradually increased from 1,000 points at the starting point over the past six months, with the standard difference of about 250 points.
As of June 13, 2024, the liquidity index has risen to 1,748 points.During the Bitcoin historical high (ATH), several outliers exceeded 3,000 points, indicating that market liquidity surged in the short term and was an important signal for price increases.It is worth noting that this signal also appeared in early June.
BTC Liquidity Index
When we examine BTC’s liquidity index separately, we can see that the two liquidity peaks in March and June above are from BTC with a peak of nearly 4,000 points.
In contrast, BTC liquidity only has two more severe downward pins in this range, occurring in mid-April and late May, respectively.
Source: LTP Research
Source: LTP Research
Bitcoin Order Book In-depth Data
Source: LTP Research
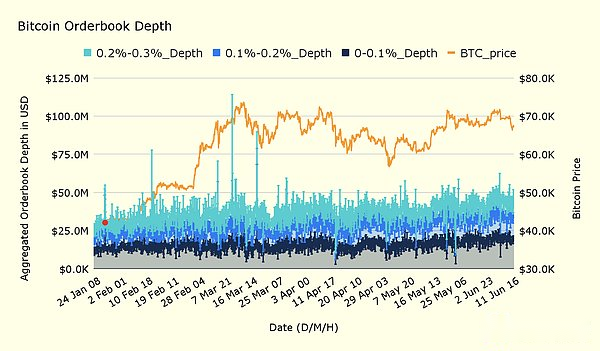
This graph shows the BTC order book layered depth data for three exchanges.
Although the BTC order book depth data is divided into five levels (0-0.1%, 0.1%-0.2%, 0.2%-0.3%, 0.3%-0.4%, 0.4%-0.5%) in actual calculation, in order toFor clarity, this figure shows only the first three gears.
It is not difficult to see that the liquidity peak that Bitcoin occurred in March mainly occurred in the range of 0.2%-0.3%.
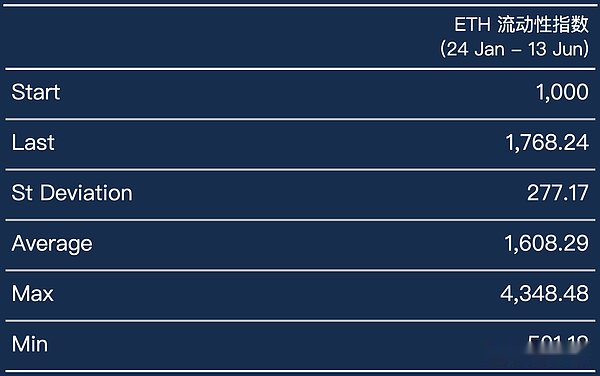
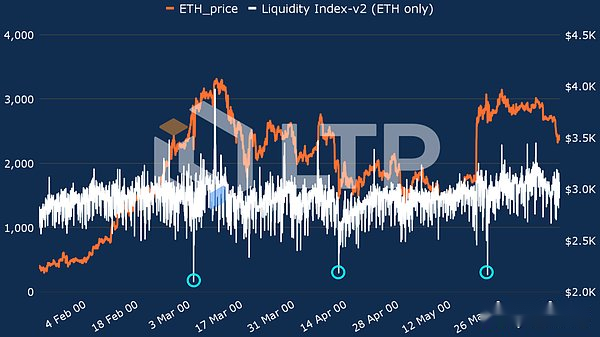
ETH Liquidity Index
As for Ethereum ETH’s liquidity index, it peaked only once at 3,000 points during its all-time high in mid-March, without such a peak in June.On the contrary, the ETH liquidity index fell below 500 points at three time points: one in the early stages of March peak, one in mid-April, and one in the end of May after the Ethereum ETF was approved.
Source: LTP Research
Source: LTP Research
Bitcoin Order Book In-depth Data
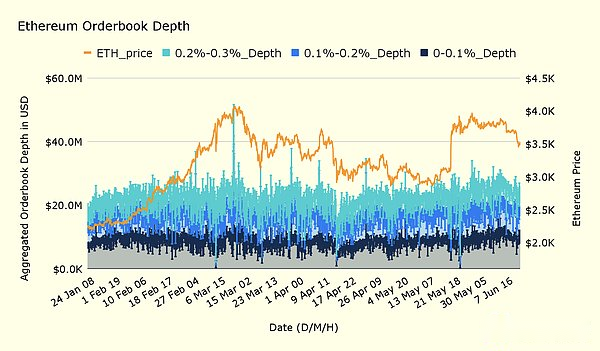
Source: LTP Research
This graph shows the depth data of the ETH order book segments of the three exchanges Binance, Kraken, and Coinbase.
Similarly, although the actual calculation divides the ETH order book depth data into five levels, the graph shows only the first three levels, i.e. 0 -0.1% to 0.2%-0.3%.
It is clear that all three liquidity troughs in the last six months have occurred in the range of 0.2%-0.3%.Each time liquidity drops sharply, the overall liquidity level drops below $10 million.
Summarize
We start with the basic concept of liquidity and introduce investors to liquidity in traditional finance and its understanding.Next, we explain how the depth of the order book on a cryptocurrency exchange affects liquidity and briefly introduces the concept of liquidity in a decentralized exchange.
We then introduce how LTP uses in-depth data from different price ranges in the exchange order book to calculate the LTP liquidity score for each exchange and cryptocurrency.After obtaining long-term data, we ranked the liquidity of 12 target centralized exchanges.
From the liquidity score data, we can see that the top four exchanges with the best liquidity are Binance, Kraken, Coinbase and OKX, and their sorting can remain relatively stable during the observation phase of more than 6 months.Since March 2024, Gate and KuCoin’s liquidity performance has gradually increased.Bitfinex’s liquidity shows high volatility.
Furthermore, we compared liquidity performance of BTC and ETH trading pairs over the approximately six-month period of each exchange and observed that Binance did not always remain at the top.
Binance’s liquidity performance remains the leading position in the 0.1% price range only.Once the price range exceeds 0.3%, Binance’s Bitcoin transactions become more volatile to liquidity, while Kraken’s liquidity performs relatively high.
Finally, to assess the volatility of overall market liquidity, we introduced the LTP liquidity index.We have observed a gradual upward trend in market liquidity over the past six months.
It should be noted that the original data for this report comes from the Public Exchange Order Book API, and we only use the main trading pairs of the mainstream exchanges, so the coverage is not comprehensive.In future versions, we will include more trading pairs to make the scores and indexes more effective.