Author: UkuriaOC, CryptoVizArt, Glassnode; Compiled by: Deng Tong, Bitchain Vision
summary
-
After successfully breaking through several important technical and on-chain pricing levels, the spot price of Bitcoin briefly rose to more than $69,000.
-
From an on-chain perspective, all sub-coin age groups in the short-term holder group now hold unrealized profits, which may be the driving force behind market sentiment.
-
However, speculation in the futures market is increasing, with open contracts surging to new ATH, a large part of which is attributed to cash arbitrage trading.
Accelerate price action
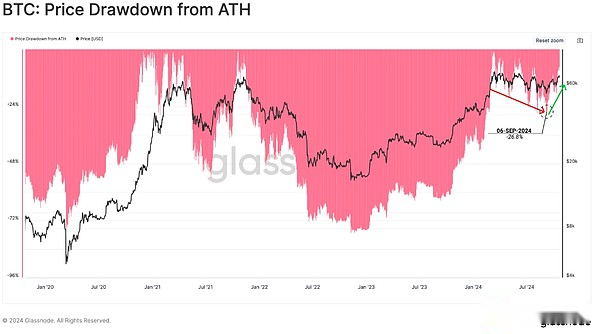
Bitcoin spot price rose this week, rebounding to $69,000, approaching the $73,000 ATH set in March.The market trading price is only -6.8% lower than the highest price, which has given many investors a sigh of relief after seven months of sideways.
When we measure the depth of retracement relative to ATH over a period of time, we can see thatThe severity of this pullback is more in line with the upward cycle in 2021 and less in line with the bear markets in 2019 and 2022.
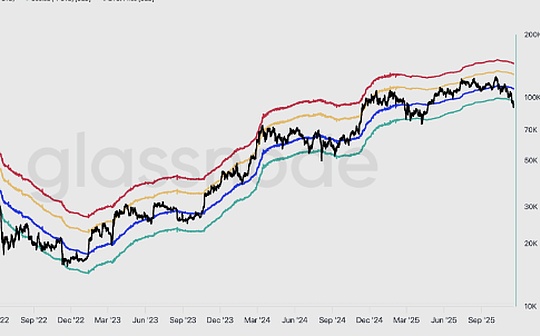
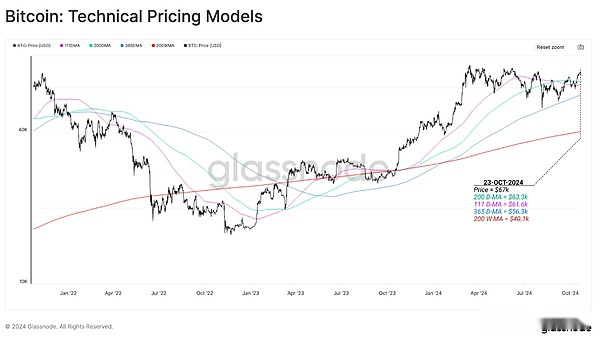
We can further understand the market’s elasticity by comparing spot prices with key technology pricing levels.The rebound saw the market break through the combined resistance of 200DMA (green) and 111DMA (blue), to which Bitcoin investors tend to react.
Interestingly, the 365D SMA has always served as a support or stubborn resistance at the turning point of the macro market.Recently, the 365-day moving average played a strong support role during the 5-day yen arbitrage closing of the August 2019, and so far it has defined the lower limit of the current macro uptrend.
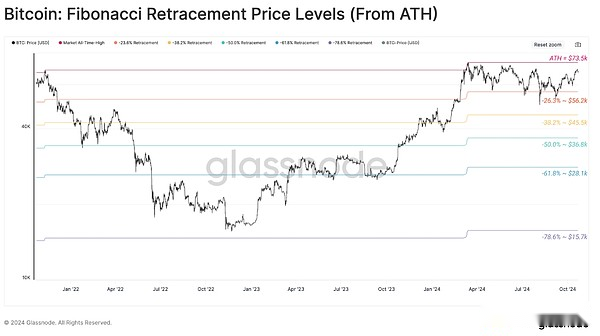
From the perspective of Fibonacci retracement levels, spot prices are primarily limited to ATH and -23.6%, as the general lower limit for the overall range of price trends.
Bitcoin is extremely atypical for months to trade in such a range, highlighting the uniqueness of this period of sideways and volatility.Normally, the Bitcoin market will rebound to a new high or sell more severely, which will trigger this consolidation period.
Key on-chain pricing levels
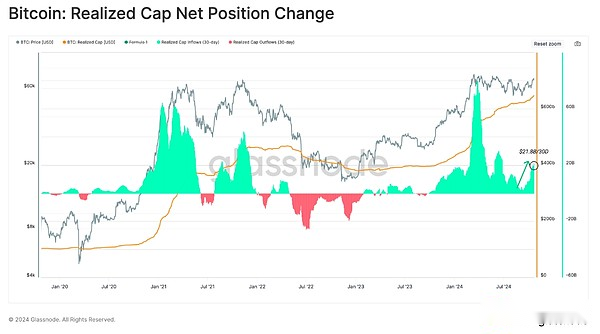
Net capital flowing into Bitcoin assets has also accelerated inflows, increasing by $21.8B (+3.3%) over the past 30 days.This causes the implementation cap to rise to the new ATH, reaching more than $646B.
This showsLiquidity across the asset class is rising, meaningful capital inflows support price increases.
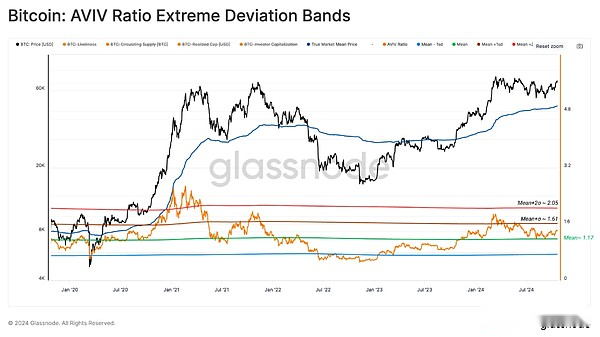
The AVIV ratio is a basic indicator in the on-chain analyst toolkit that evaluates the size of book gains/losses held by active investors (through inactive entities such as discounted losses and long-term dormant supply).
The AVIV ratio is above its historical average year-to-date and rebounded strongly from that average when the yen arbitrage trade was lifted on August 5.Generally speaking, this is a constructive road sign because it shows that investors’ profitability is still relatively strong, and active investors have defended their own cost base in recent months.
Furthermore, we note that the AVIV ratio has not yet broken through the +1SD level since the ATH in March, highlighting the potential growth space if positive price momentum is established.
We can use key on-chain pricing levels to build a framework for thinking about the Bitcoin market cycle.It can be considered under the following framework:
Deep bear market: Price trading is lower than the actual price.(red)
Early bull market: Prices trade between realized prices and real market averages.(blue)
Passionate bull market: Prices trade between ATH and real market average.(Orange)
Euphoric bull market: Trading prices are higher than ATH in previous cycles.(green)
The price is trying to transition from a passionate bull state to an euphoric bull state, characterized by a continued breakthrough of the 2021 high of $69,000.This level briefly broke through during its peak in March 2024, but profit-taking was too severe at the time and it took some time to cool down investors’ excitement.

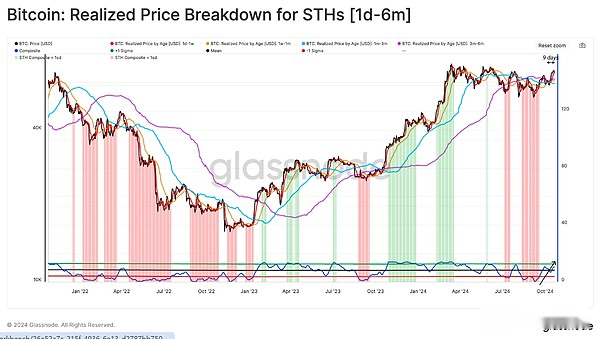
We can also evaluate the unrealized profit status of the short-term holder population, which can be seen as a representative of recent market buyer sentiment.
Currently, spot prices are higher than the average acquisition price for all short-term holders’ groups.This meansAlmost all recent buyers have held unrealized profits, underscoring the comfort this rebound has brought to investors.
Total leverage ratio increases
The Bitcoin derivatives market has experienced huge growth since the launch of its first perpetual swap instrument in 2016.The derivatives market significantly increases the depth and liquidity of asset classes, allowing for increasingly complex trading and hedging strategies.
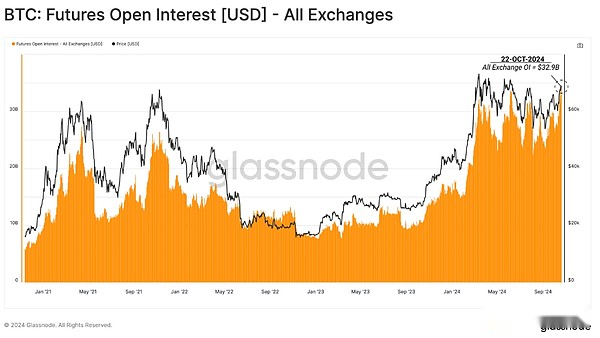
Open positions for perpetual and fixed futures contracts hit a new ATH of $32.9B this week, indicating a significant increase in total leverage entering the system.
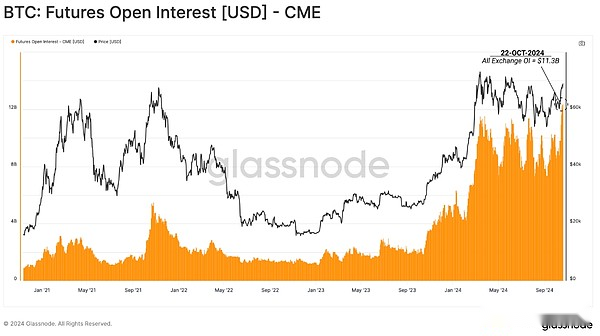
Although cryptocurrency holders prefer perpetual swap tools, CME’s traditional fixed futures contracts have greatly boosted the rise in open positions.
The product provides a new wave of institutional investors with regulated derivative exposure tools and opportunities to gain profits through cash holding strategies.Openings in CME contracts have soared to the new ATH at $11.3B, highlightingIncrease in institutional activity in the digital asset field.
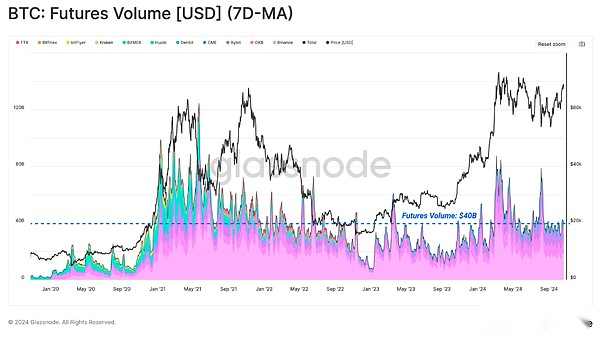
However, the volume of all futures contracts ($35B per day) remains somewhat sluggish, especially compared to the volume that the market had peaked in March when ATH reached its peak.This suggests that there is no significant driving force in trading activity and may suggest that single trading base strategies and arbitrage positions dominate more in the futures market.
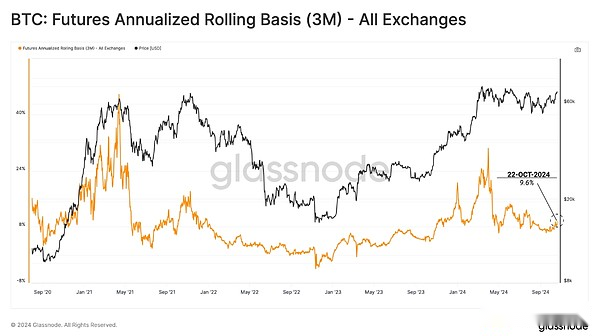
The yield through the cash holding strategy is about 9.6%, almost twice the “risk-free” yield of short-term U.S. Treasury bonds.As the Fed is expected to cut further interest rates in the coming months, such basis trading may continue to attract institutional traders and further expand Bitcoin’s market liquidity.
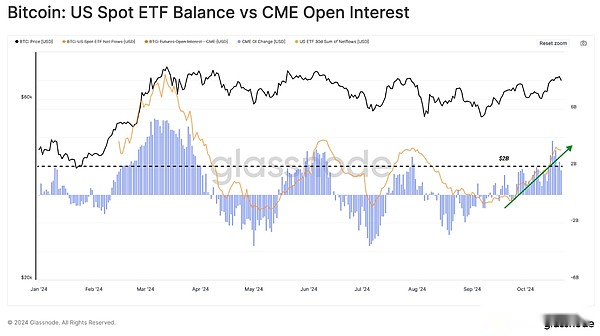
Further evidence of the increase in cash arbitrage transactions can be found by comparing the sum of 30-day ETF net traffic with the 30-day changes in CME open positions.
30-day ETF net traffic sum (orange)
30-day changes to CME open positions (blue)
We can see the degree of similarity between these two indicators, which shows that there is a relationship between long spot positions through Bitcoin ETFs and short positions through CME futures contracts for profit.
Summary and conclusion
The positive market momentum of the Bitcoin market continues to develop, with spot prices breaking through several key technologies and on-chain price levels.This brings many investor positions back to unrealized profits and may become a positive factor in market sentiment.
Open positions in the futures market have also expanded recently to reach new highest levels.CME Group’s dominance highlights the growing influence of institutional investors in the digital asset space and strongly demonstrates that cash holding strategies are playing a role.