Author: Michael Nadeau, The Defi Report; Compilation: Tao Zhu, Bitchain Vision
ETH vs BTC

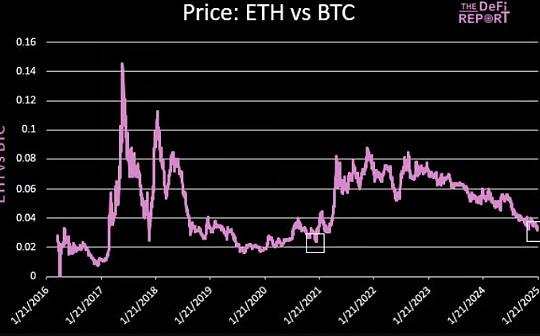
ETH/BTC continues to hit new lows.BTC’s dominance has remained unabated – now back to 59.2%.The white box above shows that ETH/BTC is even lower at the same time point in the 21 cycle.Bitcoin Maxi was thrilling at the time, as BTC dominated at the time at 63%.
Of course, ETH continued to rise five times over the next five months – as BTC’s dominance dropped to 40%.
In some cases, if ETH/BTC returns to .08 (as twice in the previous cycle), this will bring ETH above $8.2k at the current BTC level.
We still think ETH will have its highlight moments.
But I admit that my beliefs are weakening.
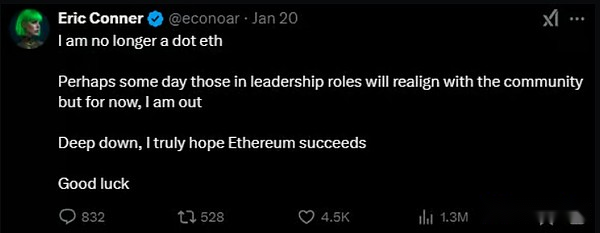
What I’ve been thinking about is that there are still many ETH big guys.But I also see the community a bit divided.Just this week, we saw several prominent members of the Ethereum community delete .eth from their X profile.
This may be just a noise or bottom indicator.Meanwhile, you now have an interesting setup between ETH and SOL:
-
Ethereum has a market value of 3.2 times that of Solana, but in terms of fundamentals, developer interests and mental share, Ethereum has been far surpassed by Solana.
-
ETH’s maxis begin to question their loyalty to the chain.
-
Solana continues to attract developers and launch new tokens (Trump memecoin, Pudgy Penguins memecoin)
If you look far, you can start thinking about what Solana needs to do to disrupt Ethereum from now on.For example, does Solana have to rise 3.2 times?Or, what percentage of the Ethereum community will eventually surrender and swap a portion of the ETH they hold for SOL?
If it were the latter, then “subversion” could happen faster than one would expect.In this case, ETH will fall, while SOL will rise at the same time.
We saw this last weekend when Trump launched memecoin.As many investors swap their existing memes for TRUMP, almost all other memes fell immediately.
As mentioned earlier, .eth’s condemnation of Ethereum may actually be the bottom.
Of course, this does not mean that there are any serious problems with ETH or Ethereum.As far as we know,The community is implementing its roadmap.There is still a lot of innovation, developer talent, on-chain value and network effects in Ethereum.
But you don’t have to believe me.You can study the basics on the chain yourself…
On-chain fundamental updates
In this section, I will use some new data to introduce some key on-chain metrics and share some key points of each metric.
L1 fee
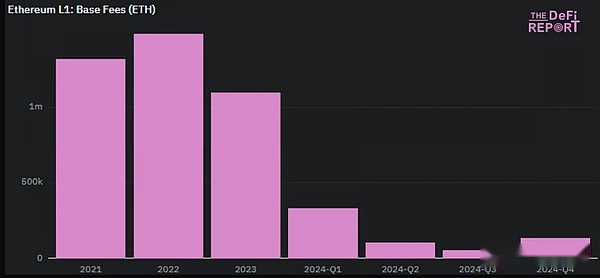
Base Cost
Key points:
Since 2022, the underlying expenses (destroyed) have increased in the fourth quarter (up 135% from the third quarter).However, the base expenses in 2024 fell by 42% compared to 2023.
Uniswap, Tether, MEV Bot, Circle and Banana Gun (Telegram Trading Bot) are currently the top five contracts that consume the most gas on L1.
The top-ranked contracts reveal the main uses of cryptocurrencies at present: 1) speculative trading of assets, 2) stablecoins.
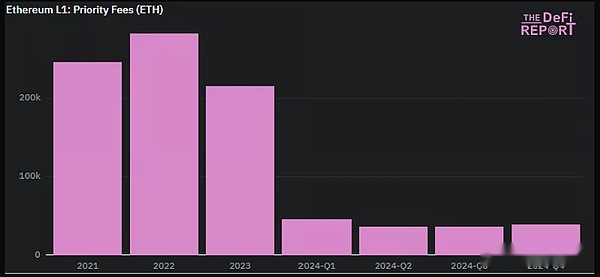
Priority Fees
Key points:
Priority fees (paid to ETH validators and stakeholders) rose 8% in the fourth quarter but fell 21% from the first quarter.This year, priority fees fell by 26%.
The fourth quarter’s priority fees were lower than in the first quarter, which was surprising.This means there is less speculation on L1 in the fourth quarter (after the election) than at the beginning of the year (before the ETF announcement).
We think there are two main reasons for this:1) The user is turning to L2, 2) The user is turning to Solana.
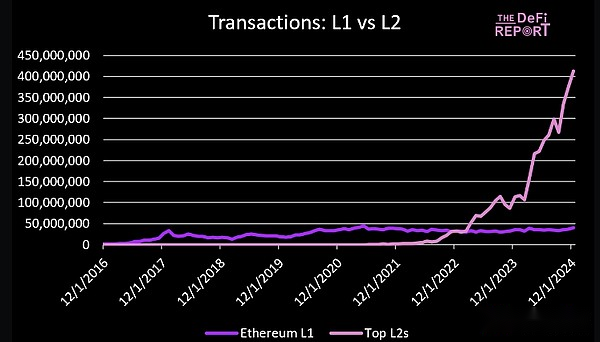
L1 and L2 transactions
Speaking of L2.Ethereum L1 struggled so much last year in part because of the EIP4844 network upgrade – it introduced a new data type called “blobs” on Ethereum.These “blobs” allow L2 to store transaction data on L1 at very low cost.
This leads to 1) cheaper L2 fees and 2) no L1 congestion – because L2 transactions no longer compete with regular L1 transactions.The lower the level of congestion L1 = the lower the priority fee.
But let’s take a look at user activity at L2 level.As we pointed out,Users are turning to L2 (short-term bearish, long-term bullish ETH) and Solana (short-term + long-term bearish ETH).
Key points:
Currently, the number of transactions in top L2 is 10 times that of Ethereum L1.A year ago, that number was 3 times.Two years ago it was 1 times.
Power law works in layer 2.Base controlled 64% of trading activity in the top L2 in December.Arbitrum ranks second with 18%.OP has 7% market share.Six months ago, Base had 42% of the market share, while Arbitrum had 27% of the market share and OP had 9% of the market share.
We expect the door to enter the cryptocurrency space to open, with many going to choose to build their own L2.Given the current power law, it will be interesting to see how this will work.Will institutions launch their own universal L2?Build on Unichain?Build on the OP stack?Time will tell us the answer.
But what does all this mean for the accumulation of value of Ethereum L1?After all, if L2 succeeds, shouldn’t this drive the demand for ETH (users on L2 need ETH to trade) + increase settlement/accounting fees paid to Ethereum L1?
Let’s see how the data is said…
L2 fee paid to L1
Publishing Cost
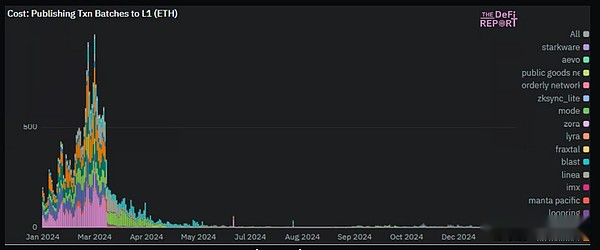
The above image shows us the cost of L2 paying to publish data to Ethereum L1.
Key points:
The EIP 4844 upgrade occurred in March.The chart shows us the impact: On March 10, L2 paid a total of 577 ETH to publish data to L1.Yesterday, they paid a total of 3.6 ETH (down 99.5%) to post the data to L1.
Ethereum subverts itself through EIP4844 so that the network can scale.If it wants to recoup these fees, we need to see a surge in L2 and new use cases – which could ultimately fill the vast new supply provided by technological upgrades that benefit L2.
Blob Fees
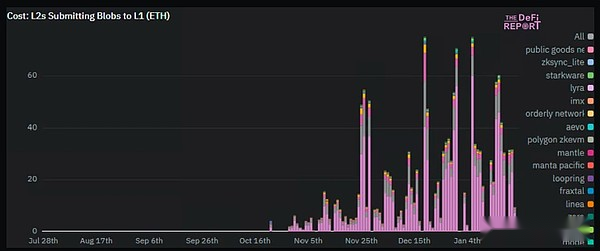
Please note thatL2 pays two kinds of fees to L1: 1) call data/release fees, 2) “blob” fees.Both should be considered as the “cost of income” of L2.Calling data costs are more expensive than “blob” costs, which is a change brought about by EIP4844.
Key points:
In the above diagram, we can see that as L2 transitions from traditional “call data” and accelerates, the blob fees are also increasing.The peak activity occurs on 1/6.But only 75 ETH paid to L1 ($277,000).
At 1/6, 16.06 million transactions are required on L2 to incur a blob fee of $277,000 ($0.017 per transaction).
At the peak of the 21-cycle, Ethereum’s L1 fee was about $70 million per day.To get the blob fee back to that level, we need to see the volume on L2 increase to 4,117,647,058 transactions per day.
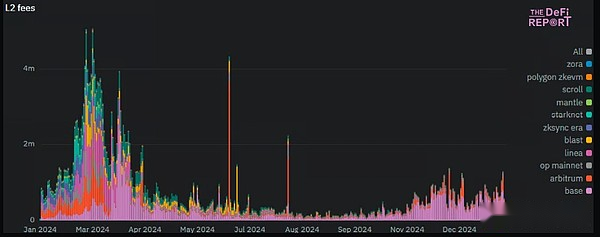
L2 User Fee
Instead pay the user fee to L2 (rather than paying L2 fee to L1).
Key points:
We can see that L2 expenses have also dropped significantly due to EIP 4844.
Just before the upgrade was implemented, the total daily user fees for L2 peaked at about $5 million.Now, they cost about $1 million a day.
With the recent increase in blob fees paid to L1, L2’s on-chain margin is currently around 85% (initially increasing to 99%).
Base dominates the L2 sector, currently accounting for an average of 70-80% of all L2 expenses.Arbitrum ranked second, while OP ranked third in terms of user fees.
L2 User Fees as a percentage of L1 User Fees
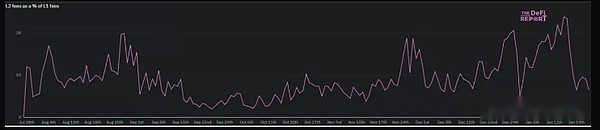
Key points:
Although L2’s transaction volume is 10 times that of Ethereum L1, L2’s current transaction fee accounts for only 9% of L1’s fees – this indicatesDespite much higher transaction fees, demand for L1 block space continues.
Earlier this year, L2 expenses peaked at 24% of L1.In the future, we expect more than 90% of Ethereum L1 fees to come from L2.
Ethereum L1: Smart contracts with more than 500 interactions per day
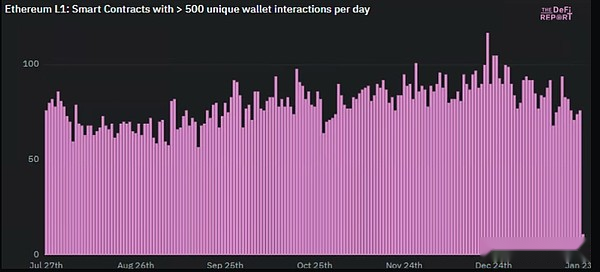
Key points:
Ethereum L1 has approximately 75 contracts and has over 500 unique wallet interactions per day.
Leading contracts are Uniswap, Tether, Circle, MEV Robot, Banana Gun, top L2 and top DeFi projects.
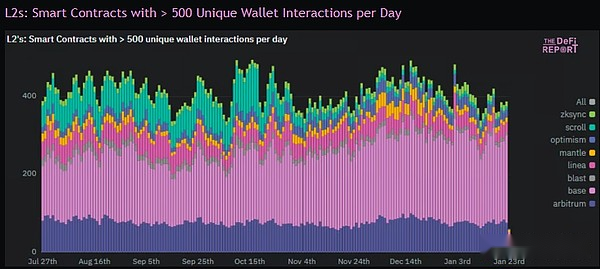
Key points:
The number of smart contracts with more than 500 independent interactions per day in the top L2 adds up to about 5 times that of Ethereum L1.
Base once again dominates the L2 space.It has about 55% of smart contracts with over 500 independent interactions per day.Arbitrum ranks second with a market share of about 20%.
Native ETH in L2
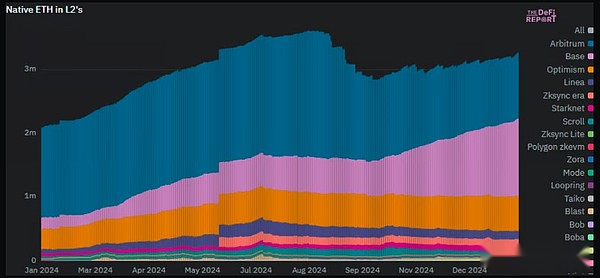
Key points:
Native ETH (excluding pledged or wrapped ETH) peaked at 3.6 million in July.It has now dropped to 3.25 million (2.7% of the circulating supply).
Base leads with 1.23 million ETH.Arbitrum has 1.03 million ETH (the above picture tells us that a large amount of ETH on Arbitrum flows to Base), and OP has 542,000 ETH.This is equivalent to 86% of the market share.
We were surprised by the migration of 2.7% of ETH to L2.This suggests that users still don’t trust L2 bridging – because 97.3% of ETH currently sits on L1 (a small amount is now in the ETF).
If we include pledged ETH and wrapped ETH, the amount of ETH on L2 will increase to 4.3 million.
ETH stake
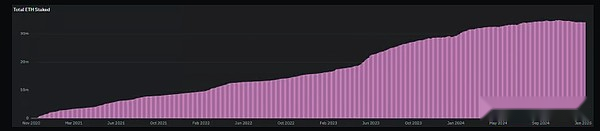
Key points:
The total pledge of ETH fell in the fourth quarter after reaching a peak of 35 million (29% of the circulating supply).Currently, it is 34.17 million.
Ethereum staking yields have dropped from 5.5% to about 3% in the past few years.The reasons for the decline are 1) the number of pledges increases, and 2) the user fees are reduced.
If expenses continue to increase and the total pledge of ETH flattens, we may see ETH’s pledge yields start to rise.
This may surprise you, but in terms of overall economic security, Ethereum has a value guarantee of $110,984,160,000.Solana has $961,818,000,000 — mainly because SOL’s stake percentage is much higher than ETH on Ethereum.Ethereum’s leading position as a more secure and decentralized network is gradually weakening as network fundamentals fade.
ETH ETF
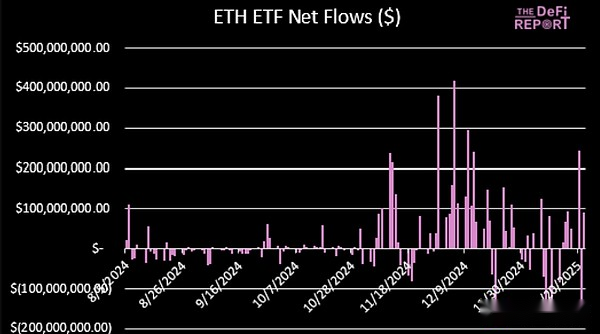
Key points:
The ETH ETF currently holds 3.65 million ETH ($11.8 billion).This accounts for 3% of the circulating supply (more than the current L2 holdings).For reference, BTC ETF holds 5.8% of the supply ($121 billion).
In terms of net traffic, the ETH ETF currently has $3.2 billion.BTC has $37 billion in net traffic.
Given that ETH accounts for approximately 20% of BTC’s market capitalization, we believe that in the later stages of the cycle, traffic may tilt towards ETH, as ETH currently accounts for only 9.7% of BTC ETF holdings.
The ETH ETF currently does not return the benefits to holders, but we expect that will change.When this happens, ETH ETFs may attract investors more than BTC.
Inflation rate
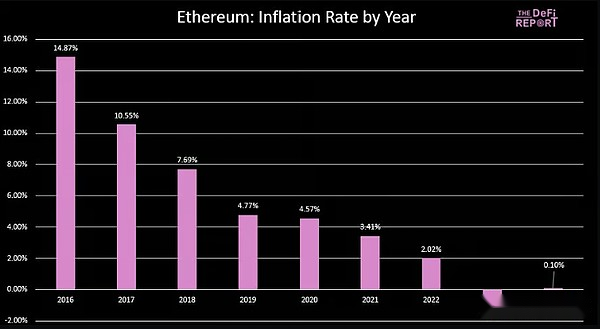
Key points:
After deflation in 2023, ETH supply increased by 0.10% in 2024.
The network was deflationary in the first quarter, but turned to inflation from the second to fourth quarter after implementing EIP4844 in March.
Inflation levels were the highest in the third quarter (0.11%) and the fourth quarter (0.11%).
Considering the challenges faced throughout the year,We think Ethereum is almost deflationary in 24 years, which is quite optimistic.
ETH vs SOL
We will conduct a comprehensive data-driven analysis in the upcoming report, so I won’t go into details here.But I want to talk about the most important metrics when comparing Ethereum and Solana at the moment:
DEX Trading Volume
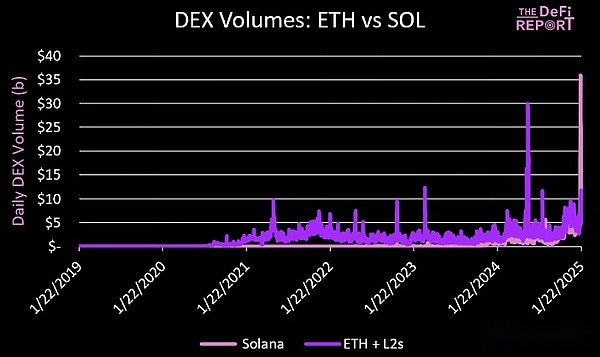
Key points:
Solana has traded $220 billion in DEX in the past month, while Ethereum + L2s has traded $172 billion.
Solana traded $36 billion last Saturday (Trump memecoin first day trading).This is 3 times the highest level in Ethereum + L2s all-time.
For reference, Nasdaq’s daily trading volume is about $200-400 billion.
We believe thatAt this stage of cryptocurrency adoption, DEX trading volume is the most important tracking indicator.Why?Ultimately, we believe that all transactions of financial assets will be transferred to the public blockchain.
For Solana, the open question is whether institutions like BlackRock will trust it as a place to deposit stocks, bonds, private assets, and more.
Qualitative Analysis
Finally, I want to share some of my views on the Ethereum Foundation, the community and the overall leadership.
-
I’m increasingly worried about Vitalik as a leader.It was not a blow to Vitalik and everything he built.It’s just that Ethereum now needs to position itself for the business/institutional community.Instead of the crypto-punk crowd.I feel like a new leadership is needed in the next stage.
-
The Ethereum Enterprise Alliance should be able to help solve this problem.This is where Paul Brody (head of E&Y blockchain) and leaders from companies such as Microsoft, Fidelity, JPMorgan Chase, Intel, Oracle and others are.Ethereum needs to see this group come forward and act as a BD for institutional use cases.
-
The Ethereum Foundation recently released its 2024 report.It covers internal and external spending…a microcosm of where Ethereum is today.
-
Obviously,Solana is growing faster.Have a more consistent community.Focus on its end users (rather than ideology).And have a technically superior L1 architecture.But that doesn’t mean Solana won’t have an extension problem that requires L2.This has happened.
In short, Ethereum subverted itself through the EIP4844 network upgrade in 2024.Shortly thereafter, it lost its motivation.
Having said that, Ethereum is still moving forward steadily.It is executing its roadmap.We’ve seen highlights throughout the ecosystem, especially on Base.In some ways,Ethereum feels like it is becoming a value game.The challenge is that the crypto market does not operate on value.Therefore, Ethereum needs a major catalyst.We believe this may come in the form of a major statement that large TradFi participants built L2 using scripts developed by Coinbase.
Is this enough to turn the situation around?
In the long run, will any of us remember the failures of EIP4844 and .eth in 2024?
Time will tell.