Author: Yashu Gola, CoinTelegraph; Compiled by: Deng Tong, Bitchain Vision
On August 5, Ethereum’s native token, Ether, fell to its lowest point in three years against Bitcoin amid global market turmoil.This sharp decline causedETH/BTC’s return so far has fallen by 25%.
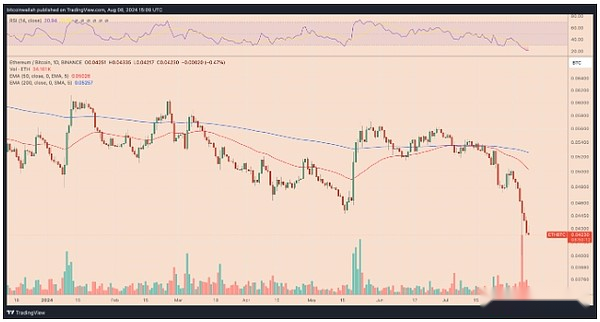
ETH/BTC daily price chart.Source: TradingView
Although Ethereum’s spot exchange-traded fund (ETF) has been launched in the United States, its performance continues to be inferior to Bitcoin.As many analysts predict, this could be a catalyst for attracting institutional capital into the Ethereum market.
SOL is defeating Ether
Ethereum’s performance with worse relative to Bitcoin is consistent with its decline in dominance relative to its largest blockchain competitor, Solana and its SOL tokens.
It is worth noting that the SOL/ETH pair has risen 10.75% in the past 24 hours, hitting a new high of 0.064 ETH on August 8.This surge is consistent with the launch of the Brazilian spot Solana ETF.
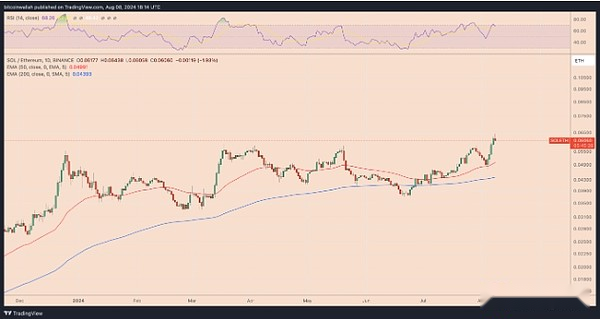
SOL/ETH Daily Price Chart.Source: TradingView
Meanwhile, it is part of the rebound that has begun in June.Since then, the pair has rebounded by about 75%.
Ethereum ETF’s first performance is inferior to Bitcoin
The highly anticipated spot Ethereum ETF is listed in the United States, but investors’ reactions are unexpectedly cold.According to Farside Investors, they have flown out $387.7 million since the investment instruments went online on July 23.
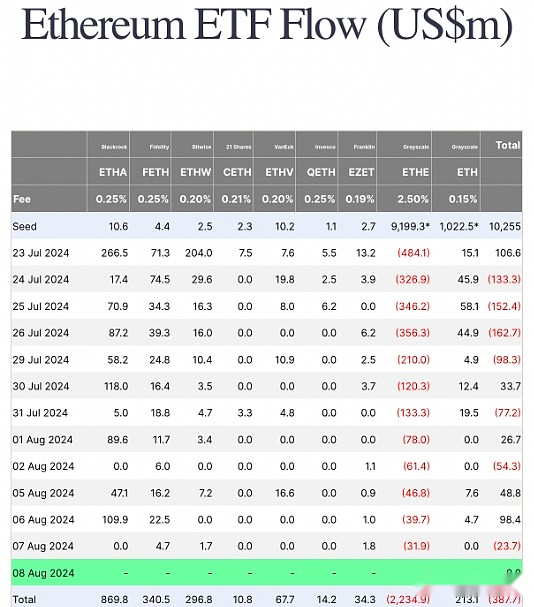
Ethereum ETF liquidity.Source: Farside Investors
By contrast, the Bitcoin ETF had a positive net inflow in the first two weeks after its launch on January 11.
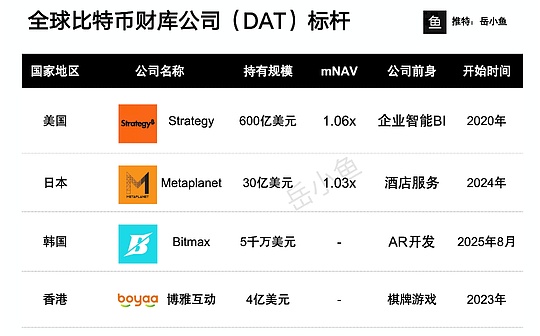
Bitcoin is mainly regarded as a “store of value”.On the other hand, Ethereum is seen as a platform for decentralized applications and smart contracts.This fundamental difference may affect the preferences of traditional investors.
For example, according to CoinGecko data,Only 6 listed companies hold Ethereum as reserve assets, while Bitcoin has 29 companies.
Ethereum enters downward channel
From a technical point of view, the decline in Ethereum against Bitcoin is part of a downward trend that has emerged within its current downward channel since September 2022.
In May 2024, ETH/BTC tested the uptrend line of the channel, which was about 0.056 BTC, and has since been pulled back by up to 30%.Interestingly, the same uptrend line coincides with the other two resistance levels, namely the 50-week (red) and 200-week (blue) exponential moving average (EMA).
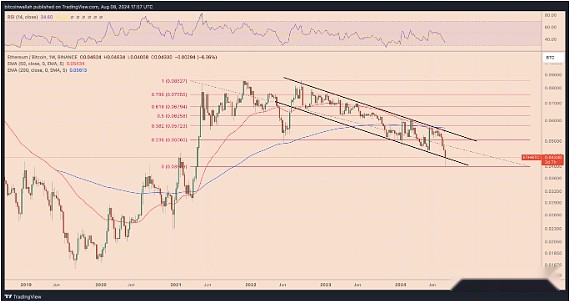
ETH/BTC weekly price chart.Source: TradingView
Nevertheless, as of August, Ethereum is still testing the channel’s downtrend line in search of a rebound, with its potential upside target of about 0.050 BTC.This level coincides with the 0.236 Fibonacci retracement line for ETH/BTC.
The possibility of a rebound is further increased as Ethereum’s weekly relative strength index (RSI) reading is 34.60, just over 4 points from its oversold threshold level.Oversold RSI usually precedes the rebound or consolidation period.