
Author: Digital Asset Research Translator: Shan Oppa, Bitcoin Vision
This month, we focus on Ethereum – its major Fusaka hard fork upgrade is about to be implemented, and a series of key time catalysts also indicate that the market may usher in an important cyclical turning point.
In July of this year, we conducted a comprehensive analysis of Ethereum’s rise.Although the ensuing pullback was larger than our initial expectations, our timeframe analysis approach once again demonstrated its reliability – as predicted, the market peak occurred in the first week of September.
Now, we will use the same analytical framework, combining seasonal patterns, time cycles, macro cycles and other indicators to analyze why Ethereum is expected to bottom out this month.
First, let’s take a panoramic view of Ethereum’s monthly cycle, and then focus on the current trend. We can understand why December is likely to become a key reversal node.
Ethereum monthly cycle
Looking at this 40-42 month “low to low” cycle, major cycle lows have occurred roughly every 42 months in Ethereum’s short history.The chart below shows that the intervals between monthly closing lows exactly fit this timing pattern.
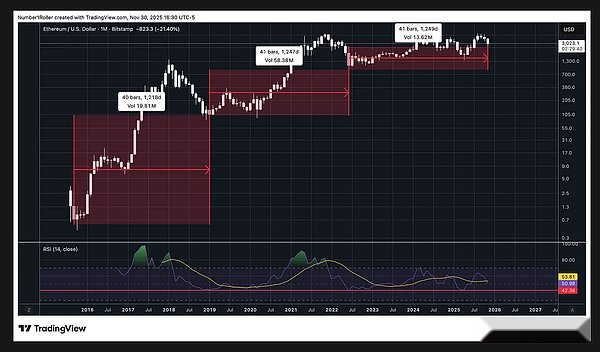
With 42 months equaling approximately 3.5 years, this cycle is significant – it is exactly the midpoint of Gann’s 7-year cycle.Here is what Gann said about the 7-year cycle:
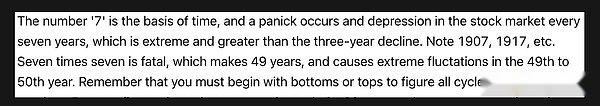
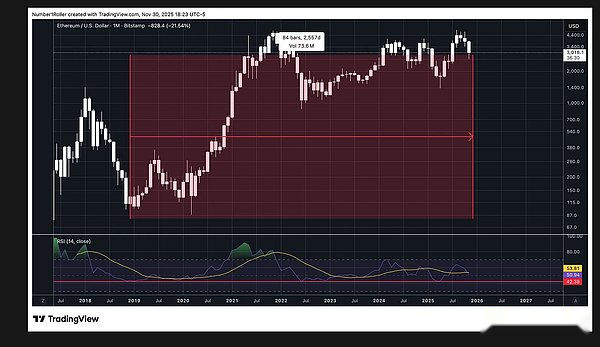
If this 7-year panic cycle is completed, this month (December 2025) will correspond to month 84, which exactly coincides with the bottom time in 2018.
We can also use Ethereum’s historical low as a starting point and extrapolate forward 84 months, and the time is November 2022 – when the FTX exchange collapsed, it was undoubtedly the panic low of the market.
December is a high-probability turning point
It can be seen that this month we are in the strong cycle turning point range of 3.5 to 7 years.But to test that, we need to look back at how often December has been a major turning point in Ethereum’s history.
The arrows in the chart below mark every December since Ethereum’s inception in 2015: green arrows represent major bottoms, red arrows represent major tops, and blue arrows represent no major turning points.
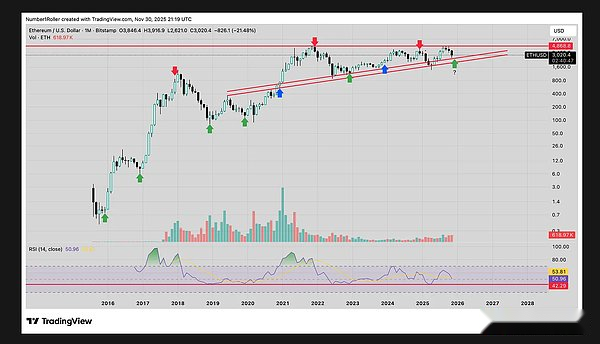
It can be said that in 8 out of 10 years, December has almost corresponded to the absolute top or absolute bottom of Ethereum.Of these 8 turns, 5 were major lows and 3 were major highs.Taking into account the probability of a major turning point next month, combined with market sentiment, price levels and monthly cycles, we have reason to believe that a major low is more likely to be formed this time.
weekly time period
Next, we need to consider how long the cycle runs.To analyze any market, it’s important to understand the typical duration of its ups and downs – this was key to our successful prediction of Ethereum’s peak in the first week of September in our July 17 report.
This time, we will focus on the average weekly pullback magnitude for this cycle since the 2021 top.
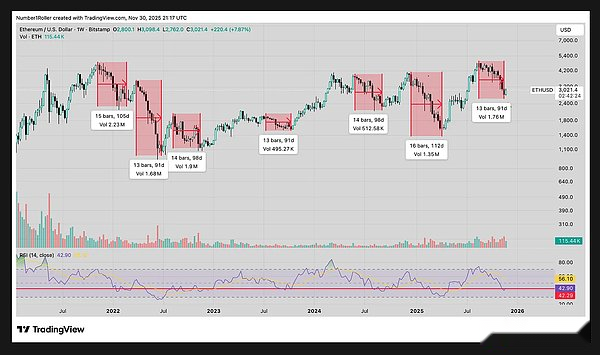
As shown in the chart above, during this cycle, the average end time of weekly corrections is concentrated in the 13-16 week range.Currently, the market is in this critical window.
important time factor
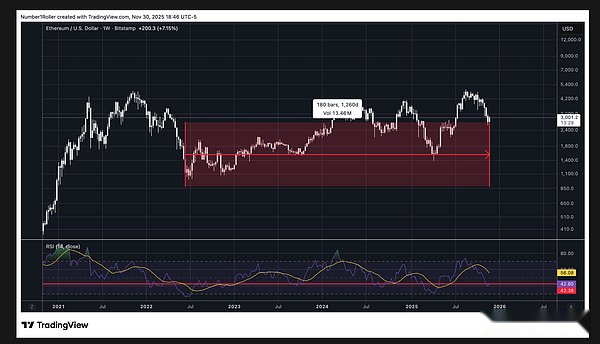
After understanding the macro cycle, seasonal patterns and market duration, we also need to pay attention to the important time factors that drive all market turns.Let’s start with the all-important 180-week cycle – a timing factor that has accurately captured this year’s major market turns many times since the 2021 top.
Approximately 180 weeks after the 2021 high, the market reached its April 2022 crash low.
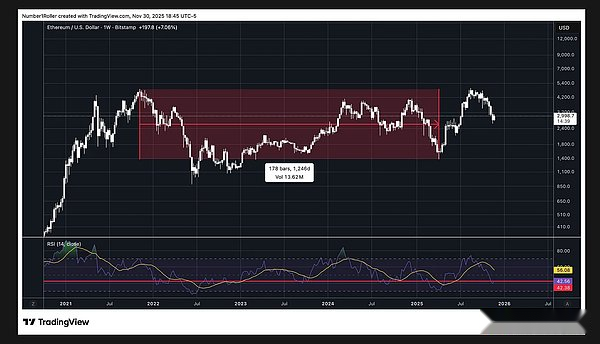
The next big turn is the March 2022 high before the market crashes.This point in time is exactly 180 weeks from the September 2021 top.
Now, we are at the next critical turning point – not just an ordinary turning point, but potentially a major bear market bottom.Currently, we are at the 180-week cycle position of this node.
The importance of the 180-week time factor is self-evident, and all the major turning points of the past year coincide with the 180-week point.
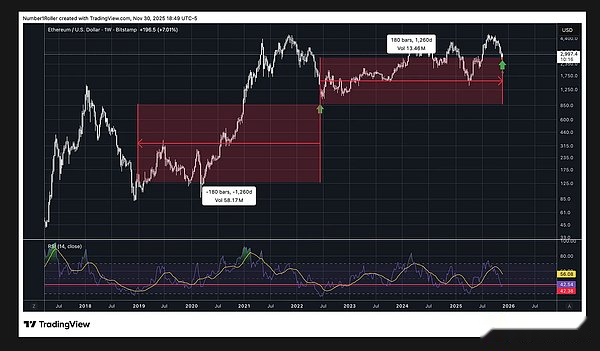
In fact, going back further reveals that the 2022 bottom is also almost 180 weeks away from the 2018 bottom.
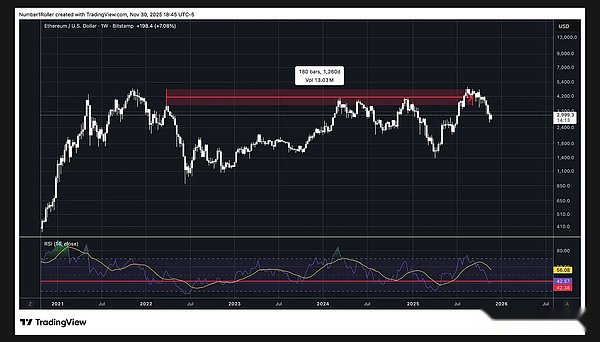
We can also break this time factor down into 90-week “half-cycles” (what Gann calls the “midpoints”).
From the 2022 low to the March 2024 high, that’s exactly 90 weeks — certainly a significant high.Today, we are 90 weeks from that high and the cycle is nearly complete.
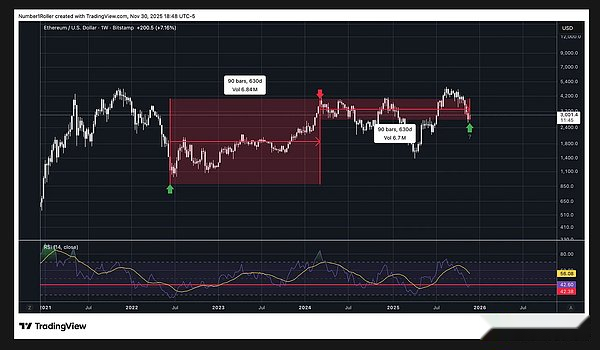
If this resonant signal is not enough to convince you, we can focus on the daily cycle: Ethereum’s low last week was exactly 90 days away from the previous high.
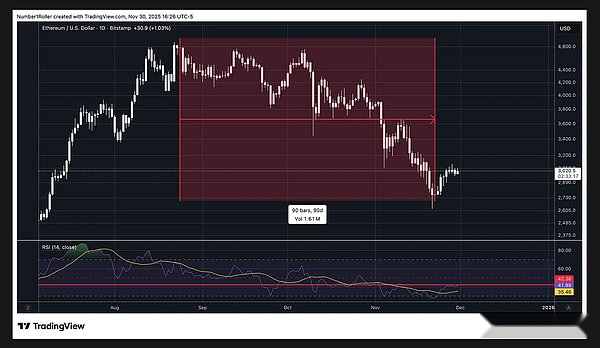
These time periods are crucial and help us predict almost all major market turns months in advance.The current market landscape exhibits the characteristics of a “wheel within a wheel”: 90-day cycles, 90-week cycles, and the larger 180-week cycle are superimposed on each other.
Time tells us again that the market is ushering in a major turning point.
BTC.D and ETH/BTC
To further prove why this month is a major macro turning point, let’s analyze the exchange rate relationship between Bitcoin and Ethereum and Bitcoin (ETH/BTC).
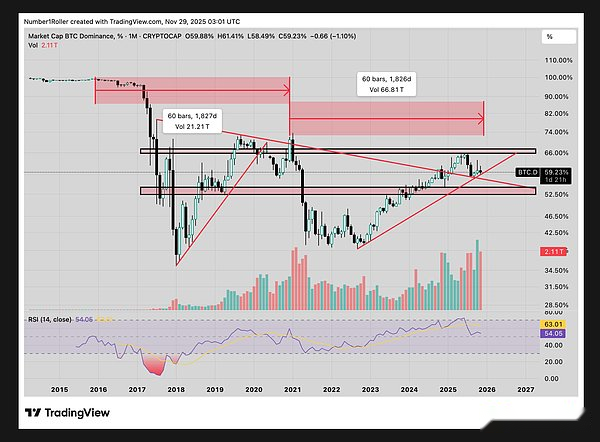
Let’s look at BTC.D first: This indicator exhibits 60-month cycle characteristics and is poised to form significant highs.The trend of BTC.D during this cycle is more complex, but these important time factors are traceable in all charts.Currently we only have one full cycle as a reference (not an ideal situation), but judgments need to be made based on the available data.
This cycle shows that BTC.D’s “high to high” cycle is 60 months, and next month (December 2025) happens to be the 60th month after the December 2020 high.
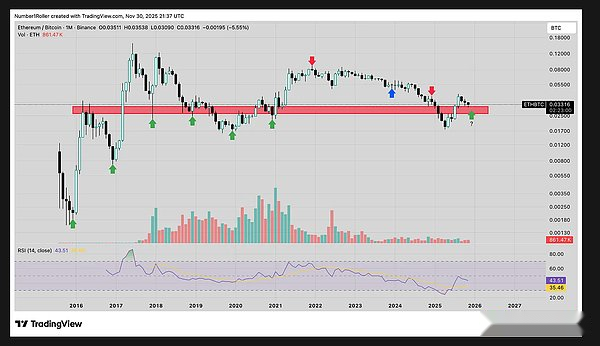
Looking at the ETH/BTC exchange rate, we have also marked every December since its birth. Among the 7 major December turning points, 5 were lows, and most Decembers marked important monthly turning points.
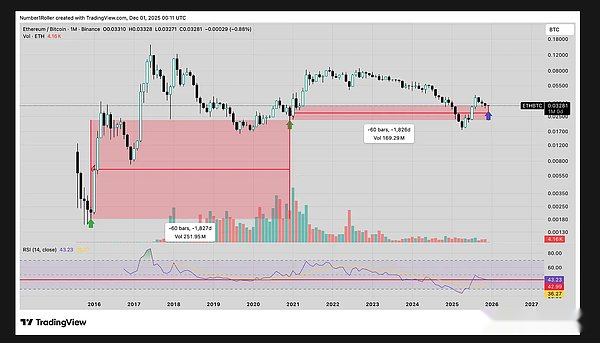
Furthermore, the 60-month Gann cycle of the ETH/BTC rate in the chart below resonates with the 60-month high cycle of BTC.D, both pointing to December as the “low to low” reversal month.
price level
Since the probability of a major turning point is extremely high, we need to combine price and sentiment to judge the market direction.Most readers must be aware that the current market sentiment is still in a state of extreme panic, and public attention is close to historical lows.
But what signal is price sending?
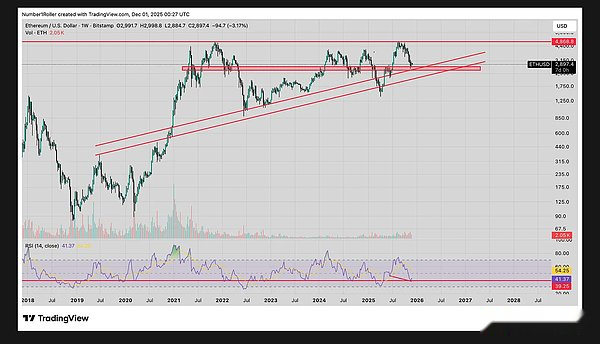
The first key indicator is the 50% retracement level.This level must be held if the market is to maintain a bullish pattern.From different time dimensions, it may have fallen below this level in the short term, but not necessarily in the long term.
However, I am more concerned about whether the key levels at the macro cycle level remain intact – and looking at the monthly chart, the answer is yes.
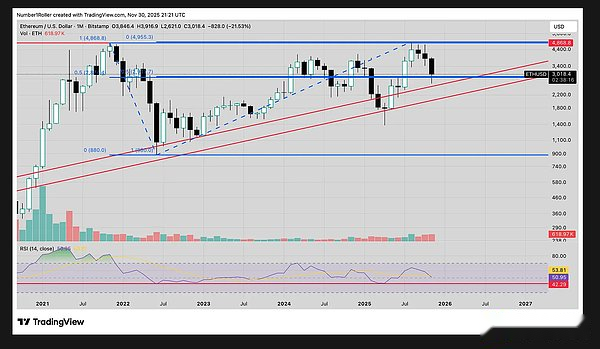
Additionally, the market is still forming macro-level “higher highs” and “higher lows,” a typical bull market structure.
Zooming in to the weekly chart: Ethereum is sitting above the key support level it has been battling since the start of 2021, and the weekly RSI indicator is showing a buy signal with bullish divergence.This at least indicates that the market will usher in a weekly to monthly rebound.
Finally, we briefly analyze the relationship between Ethereum and copper prices – there is a strong macro correlation between copper prices and Ethereum, and copper prices are currently breaking through all-time highs.
Looking at the weekly chart of ETH/Copper, the ratio is trading around its 2017 highs — a level that has acted as strong support since the 2022 bottom.Meanwhile, a bullish weekly RSI divergence has also emerged at this key macro level.
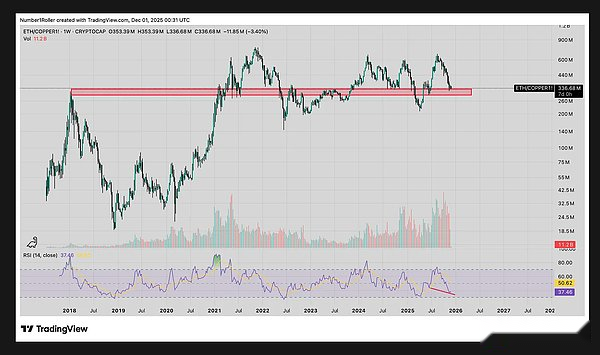
Copper has been strong, but I expect Ethereum to react strongly and start outperforming copper in the medium term.
Summary
To sum up, December 2025 is undoubtedly a major macro turning point for Ethereum.The monthly main cycle, callback cycle, December seasonal pattern and key time factors all point to: Ethereum will usher in a reversal this month.
But to be clear, I don’t think December will be a straight-line rise, but rather a gradual build of a major bottom over a period of 2-4 weeks, ultimately fueling a sharp rise from late December to early January.
Judging from the trend of BTC.D and overall macro risk appetite indicators, the market is shifting from Bitcoin to altcoins. This trend may continue until 2026, and Ethereum will lead this wave.
BTC.D may have reached its tail end, with a final high likely to occur in January next year, while Ethereum and other altcoins will bottom in the coming weeks before rising in the first quarter of 2026.
The duration of this rise is difficult to judge, but there are multiple events this month that will verify this logic: this week’s Fusaka upgrade, next week’s interest rate cut expectations, the pending “Clarity Act” and potential quantitative easing policies.
The current market is extremely panicked, low volume, oversold, and at a critical time – all hallmarks of a major monthly reversal.In my opinion, any further pullback in early December would be a buying opportunity.