
Author: Marcel Pechman, CoinTelegraph; Compiled by: Deng Tong, Bitchain Vision
The Ethereum network continues to lead the adoption of decentralized applications (DApps) in terms of transaction volume and deposits.While competitors like Solana and BNB Chain benefit from lower transaction fees, thereby increasing metrics like unique active addresses, nothing can prevent well-funded entities from overstating Ethereum’s DApps.
In fact,The recent surge in activity on the Ethereum network is different from the more macro cryptocurrency market trends, and even contradicts other usage indicators.While it is impossible to prove any manipulation, one should realize that even if transaction fees are as high as $2.40, the figures can be distorted, especially in decentralized finance (DeFi) applications where deposits can exceed $1 billion.
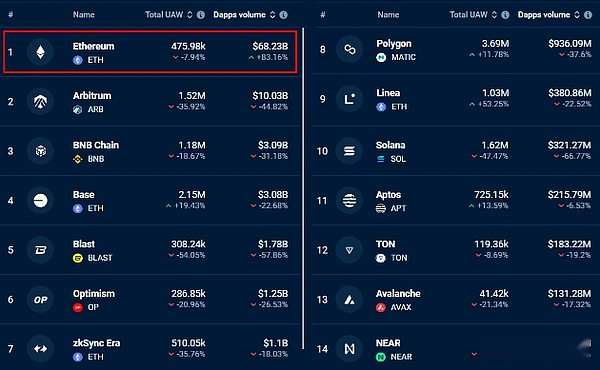
Top blockchains ranked by 7-day DApp transaction volume (USD).Source: DappRadar
It is worth noting thatEthereum is the only network in the top 20 to report volume growth, up 83% from the previous week, impressive.The average transaction volume for similar protocols such as BNB Chain, Polygon, Solana and TON fell by more than 30%.Additionally, Ethereum’s 475,980 addresses pale in comparison to BNB Chain’s 1.18 million and Solana’s 1.62 million addresses.
It is worth noting thatThe surge in Ethereum transaction volume did not match the increase in the number of users.Using unique active addresses interacting with DApps as a metric, Ethereum has 8% fewer users than the previous week, which is better than its competitors, but it is paradoxical given its substantial increase in transaction volume.
One might think that despite fewer users due to relatively high fees, the growth in Ethereum deposits may offset the decrease in activity.
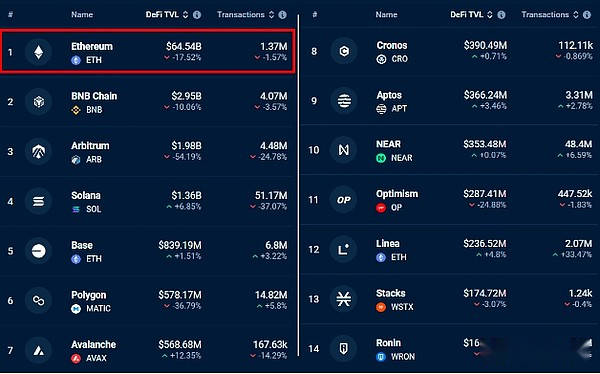
Lock the top blockchains (USD) in total value ranking by DeFi.Source: DappRadar
Data shows that the total value locked in DeFi applications dropped by 17.5% in seven days, while competitors such as Solana and Avalanche succeeded in attracting deposits.During this period, the number of DApp transactions on the Ethereum network did not increase, indicating that more thorough analysis is needed to understand the abnormal situation.
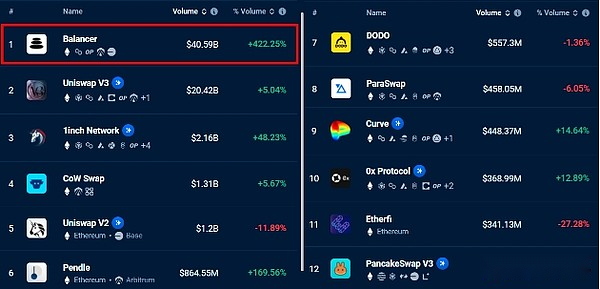
Top Ethereum DApps ranked by 7-day trading volume (USD).Source: DappRadar
Ethereum volume growth was driven mainly by Balancer’s 422% increase in 7 days, reaching a total of $40.6 billion.For example, this is 13 times the total activity on the BNB chain during the same period.However, the significant increase in Balancer trading volume is not synchronized with improvements in other indicators; the DApp’s unique address decreased by 5% in the same week and a 14% reduction in trading volume.
Excluding Balancer’s contribution, Ethereum’s transaction volume growth in 7 days actually fell by 5%, because this single DApp accounts for 59.5% of the total online transaction volume.While transaction volumes that dominate blockchains are not uncommon—BNB chains are primarily driven by PancakeSwap, and Uniswap accounts for nearly 50% of the Polygon network—the growth in activity reported by Ethereum should be viewed with caution, becauseA DApp caused errors in data.
It is challenging to identify the real demand behind the surge in Balancer trading volumes.Even if some transactions within the DApp are profitable, this does not ultimately determine the user’s intentions.For example, Binance Exchange announced on July 1 that the Balancer (BAL) token was on the potentially removed watch list, which could be related to the abnormal activity of the DApp, although it is complicated to establish a direct link between the two events.