Author: Marie Poteriaiev, CoinTelegraph; Compiled by: Tao Zhu, Bitchain Vision
summary
-
It is well known that predictions at the top of the Bitcoin market cycle are very difficult, but combining technical indicators and behavioral indicators can provide a strong signal.
-
MVRV-Z scores, Pi cycle top indicators, volume trends, Puell multiples and exchange inflows can accurately predict the top of the Bitcoin price cycle.
BTC may be approaching the final stage of its current market cycle—first with a sharp rebound, followed by a sharp pullback, eventually entering a bear market.For many, this may be the long-awaited culmination of the past four years, and major players are preparing for it.
Since the end of 2024, Bitcoin whales have seen a surge in holdings.Glassnode data shows that the number of addresses holding more than 100 BTC jumped nearly 14% to 18,200, the highest level since 2017.The largest market players appear to be preparing for the final rise of this cycle.
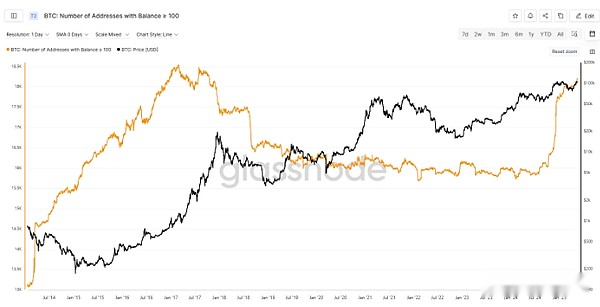
Number of BTC addresses holding more than 100 BTC.Source: Glassnode
However, taking advantage of the situation is much more difficult than imagined, and knowing when to quit is notoriously difficult.The temptation of higher prices will intensify the “fear of missing out” (FOMO) sentiment, driving investors to buy at highs, but ultimately face painful losses and even liquidated positions.
So, how do traders and investors find the top before the market enters a recession?
Bitcoin Cycle Top Mark
Several technical and on-chain indicators, such as MVRV (Raverage of Market Value to Real Value), Z value, Pi cycle top and volume trends, have historically been able to reliably predict when Bitcoin is approaching its peak.
The MVRV-Z value compares the market value of Bitcoin to its actual value and adjusts it based on volatility.Higher Z values indicate that Bitcoin is seriously overestimated relative to its historical cost basis.When the indicator is at an all-time high, the price of Bitcoin is likely to fall with it.
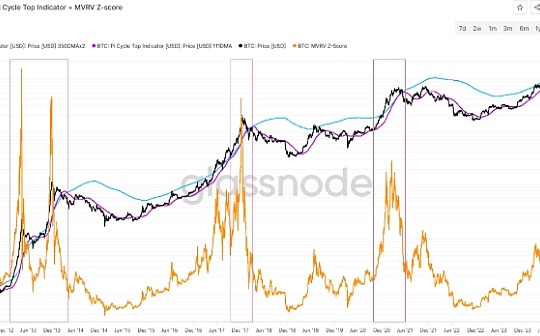
The top of the Pi cycle uses moving averages to track BTC price dynamics.When the 111-day simple moving average (111-SMA) crosses twice the 350-day average (350-SMAx2), the market is overheated.In other words, when short-term trends catch up with long-term trajectories, the market top is formed.
Historically, all previous Bitcoin bull markets have begun with a significant surge in MVRV Z value and ended with 111-SMA crossing the long-term trend line.
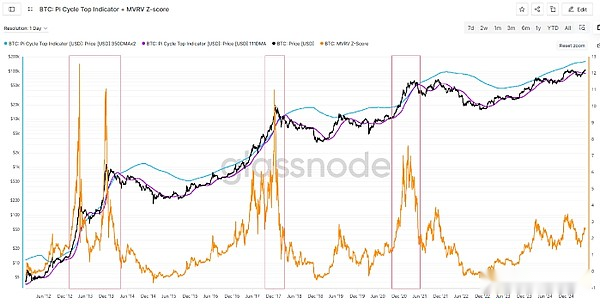
BTC: Pi cycle top + MVRV Z score.Source: Marie Poteriaiev, Glassnode
In addition, a decline in trading volume during price increases may be a warning sign, usually foreshadowing the possibility of weakening and reversal of momentum.Balanced Trading Volume (OBV) Recording cumulative trading volume is an important indicator for tracking this process.When OBV diverges from the price trend, it usually indicates an early reversal signal.
The second phase of the 2021 bull market is a good example.Although the BTC price hit a high of $68,000 (compared to the previous all-time high of $63,170), trading volumes are moving in the opposite direction, falling from 710,000 BTC to 628,000 BTC.This creates a bearish divergence between price and volume, indicating a decrease in market participants supporting the rise – a typical sign of weakening momentum.
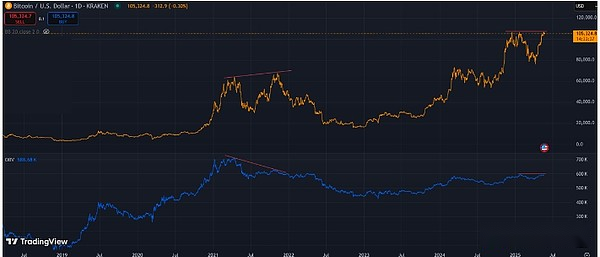
BTC/USD 1 day OBV.Source: Marie Poteriaiev, TradingView
Profit-taking indicators
As the market cycle peaks, long-term holders and Bitcoin miners often start locking in profits.Some valuable metrics can track this, such as Puell Multiple and exchange traffic.
The Puel multiple measure measures miners’ income relative to their 365-day average.High readings suggest miners may start selling heavily and often appear near the top of the market.
The massive inflow of funds on exchanges is often a sign that investors are ready to sell their cryptocurrency.
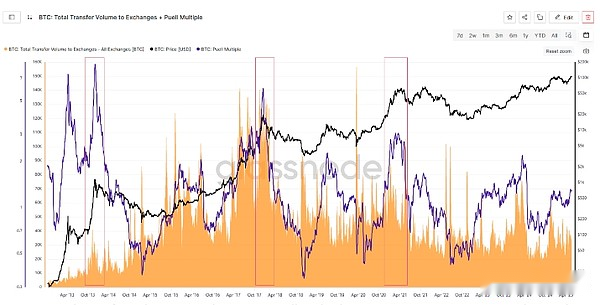
Total trading volume transferred to the exchange + Puell multiple.Source: Marie Poteriaiev, Glassnode
These indicators can be viewed separately to mark various changes in market trends.Together, they usually match the top of the cycle.
15% Rule
Historical price activity observations may also come in handy.Cryptocurrency market analyst Cole Garner shares his exit strategy based on whale behavior.His roadmap consists of three steps:
-
rise.Bitcoin fluctuated vertically for several consecutive weeks, with the daily K-line chart rising sharply by more than $10,000.
-
Oscillation.Bitcoin has experienced the most drastic pullback in a bull cycle.The curved parabolic trend line supporting the rebound was broken – this is a clear signal that the price may have hit the top.Meanwhile, the prices of altcoins and meme tokens may continue to rise for a while.
-
Complacent.Prices are below Bitcoin’s all-time highs of 15%.This is the selling area.Order books on major exchanges will often show a large number of sell orders near this level – which may be an exit point for institutional investors.
According to Garner, the 15% (or 16%) rule applies not only to cryptocurrency markets, but also to traditional markets.
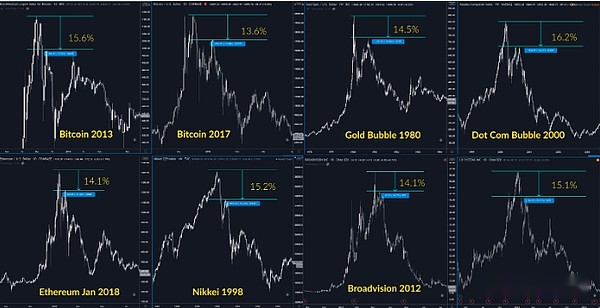
Best performance in history: BTC, ETH, Gold, Nasdaq, Nikkei, Broadvision, 3D Systems.Source: Cole Garner
No single indicator can accurately predict the timing of exit, especially in the ever-changing macro environment.But when multiple signals come together, it is difficult to ignore.The final stages of a Bitcoin bull market are exciting, but understanding when the bull market ends is the key to locking in profits.