Author: Biraajmaan Tamuly, CoinTelegraph; Compiled by: Tao Zhu, Bitchain Vision
summary
-
A bull market flag is forming on the daily chart of Ethereum, which may break through $3,600.
-
If ETH recovers the two-week Gaussian channel midline, a 90% rebound could occur.
The ETH price consolidates between $2,400 and $2,750 on the daily chart, forming a bullish flag pattern with the target looking towards the resistance area of $3,000 to $3,100.The bullish flag is a continuation pattern, following the price surge from $1,900 (black flagpole) to $2,730, with the current range forming the flag shape.
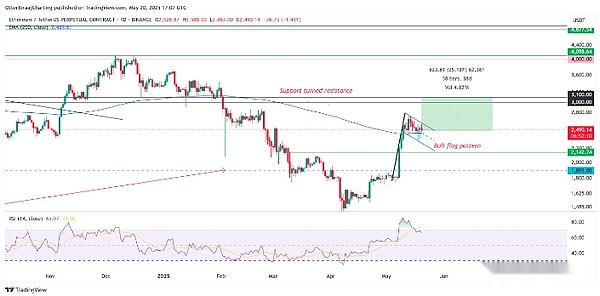
Ethereum 1-day chart.Source: Cointelegraph/TradingView
After breaking through $2,600, the target price may be $3,600 (which is calculated by adding flagpole height to breakpoints), but the current key focus area is still within the resistance range of $3,100 to $3,000.
The 200-day exponential moving average (EMA) supports the lower range.Relative Strength Index (RSI) has fallen significantly in the past few days, although it is still close to the overbought area.
The ETH breakout, accompanied by rising RSI and volume, may confirm bullish movements, while a break below $2,400 may invalidate the pattern.
Can Ethereum return to the midline of the Gaussian channel?
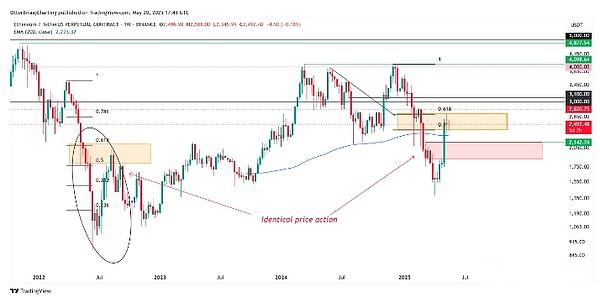
On May 20, Ethereum saw a significant trend shift as it tried to return to the midline of the two-week Gaussian channel.Gaussian channels are technical indicators used to identify price trends.Gaussian channels or normal distribution channels plot price trends in the dynamic range and can adapt to market fluctuations.
Historically, there is usually a big rebound when ETH breaks through this midline.In 2023, ETH soared 93% after a similar crossover to $4,000; while in 2020, ETH soared 1,820%, triggering a massive rebound in altcoins.
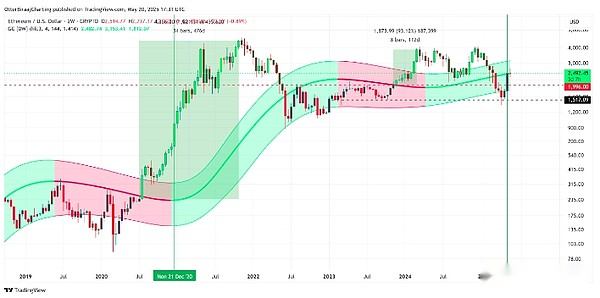
Ethereum Gaussian Channel Analysis.Source: Cointelegraph/TradingView
Instead, similar settings in August 2022 resulted in failure during market adjustment periods, highlighting the risk of relying solely on this indicator.
Similarly, cryptocurrency trader Merlijn noted that a golden cross between the 50-day moving average (SMA) and the 200-day moving average (SMA), which could further strengthen the momentum of ETH’s upcoming breakthrough.It is worth noting that the golden cross appears on the 12-hour chart, which is not as reliable as the single-day chart.
Traders are cautious before possible “range volatility environment”
Popular cryptocurrency trader XO points out that Ethereum is consolidating below the “pretty good” resistance level below the $2,800.The trader expects thatIf Ethereum fails to break through $2,800 in the next few days, a callback will occur.The analyst said:
“I tend to think that the price will form a range volatility for at least a few weeks or more, after which I will be a buyer again.”
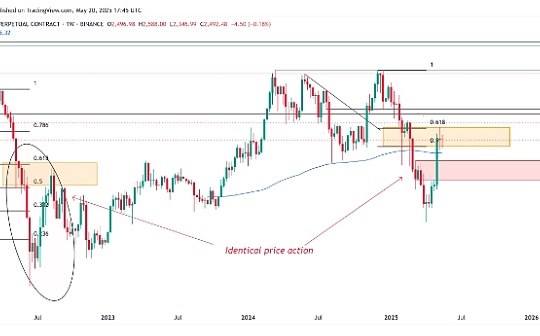
Ethereum price fluctuates below the Fibonacci level, which also reflects a bullish view opposite to the bulls.There are reports thatEthereum recently retested the 0.5 to 0.618 Fibonacci levels, which could trigger a short-term pullback for Ethereum.
In this case, short-term support is still around $2,150 and $1,900, which may slow the bullish momentum over a longer period of time.
Ethereum price analysis for one week.Source: Cointelegraph/TradingView