Author: Allen Chow (founder and CEO of AI on Web3, Inc./ AI On Web3 Co., Limited) and team
In the first half of 2024, Asia’s blockchain game (Web3 game) market made significant progress in many aspects compared with 2023, promoting the overall development and maturity of the market.
(1)useIncrease households~In the first half of 2024, the number of Asian Web3 game users increased by 35% year-on-year to 30 million active users.New users (first registration in the past year) account for 20% of the total users, an increase of 5 percentage points from 15% in 2023.
(2)TechniqueTechniquestep~The number of games using Layer 2 solutions (such as Polygon, Optimism) has increased by 50%, accounting for nearly 60% of all Web3 games.Transaction fees were reduced by 30% on average and transaction speeds were increased by 40%.
(3)throughBusiness model~The number of new NFT types added in the game increased by 45%, and the NFT transaction volume increased by 70% year-on-year to US$1.5 billion.In-game token trading volume increased by 60% year-on-year to $2 billion.The proportion of users participating in in-game economic activities (such as pledges, loans) has increased from 30% to 50% in 2023.
(4)mutualMove socializing~The number of active users participating in DAO governance increased by 40%, reaching 25% of the total users.The frequency of in-game social interactions (such as chatting and teaming) increased by 35% year-on-year, with more than 10 million active social users per day.
(5)castInvestment growth~The total investment in Web3 game projects by venture capital and institutional investment increased by 50% year-on-year to US$3 billion.
In order to gain an in-depth understanding of the behavior, preferences, and experience of blockchain game users and how they interact with blockchain technology, NFT gameplay and cryptocurrency exchanges, AI on Web3 has a high penetration rate of blockchain games in Asia in the first half of 2024Users from seven major regions conducted online questionnaires and wrote insight reports.
●Summary of the core content of the report
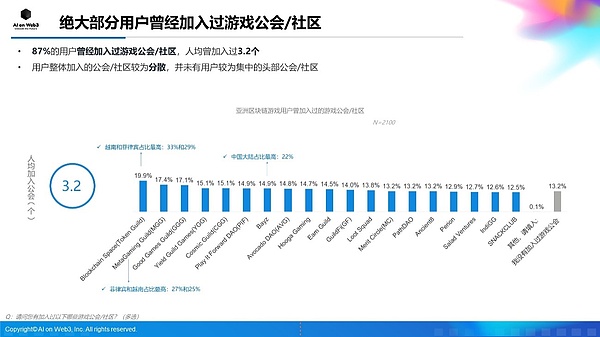
(1)useHousehold background and game behavior preferences
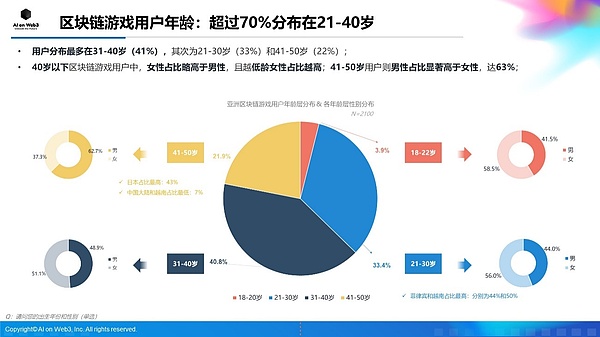
The age distribution of users shows that more than 70% of Web3 game users are between 21 and 40 years old.Users aged 31 to 40 account for 41% of the total users, and users aged 21 to 30 account for 33%.The proportion of female users under the age of 40 is slightly higher than that of male users, while the proportion of male users aged 41 to 50 is significantly higher than that of female users.
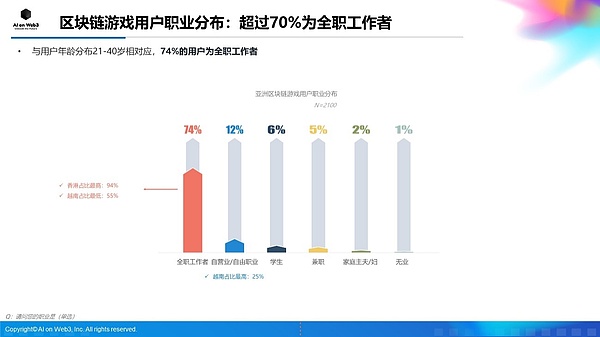
In terms of career, more than 70% of users are full-time workers, and another 12% are freelancers or self-employed people, indicating that blockchain games have attracted a large number of people in the workplace.
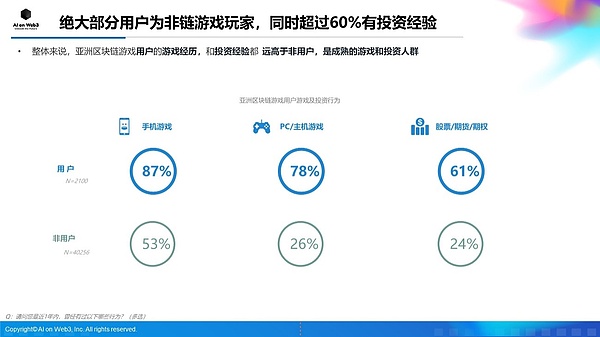
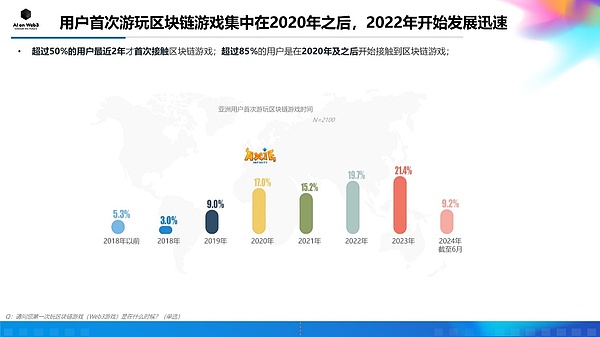
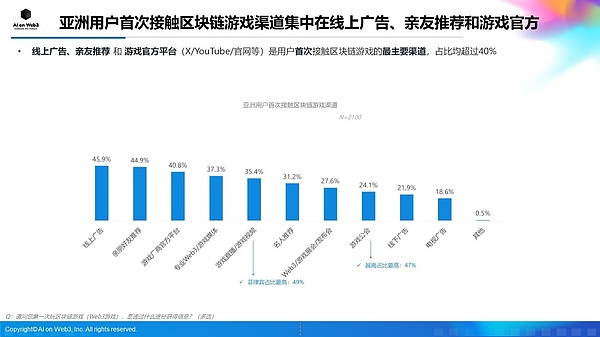
In terms of gaming and investment experience, 87% of users have experience in playing mobile games, 78% have experience in PC or console games, and more than 60% of users have experience in investing in stocks, futures or options.More than half of users have been exposed to blockchain games for the first time in the past two years, and more than 85% have started contacting in 2020 and after.
(2)tourToken trading behavior and experience
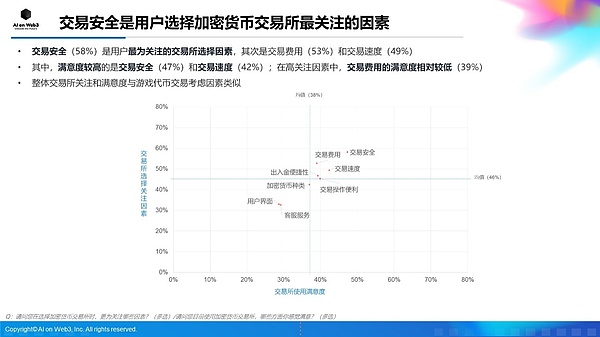
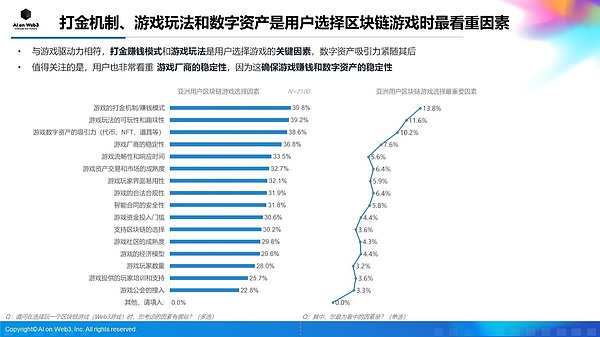
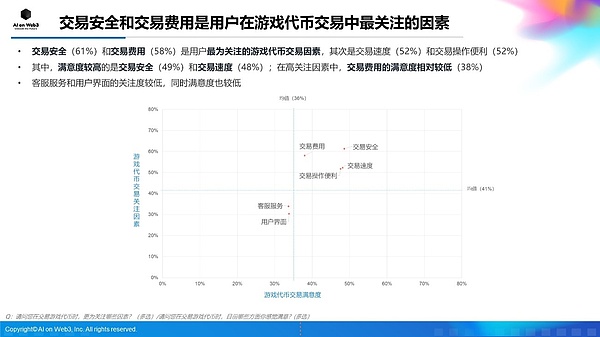
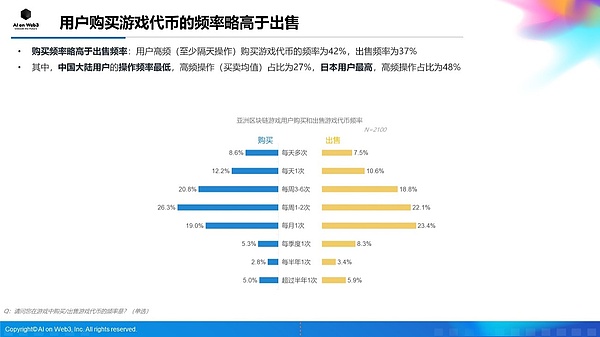
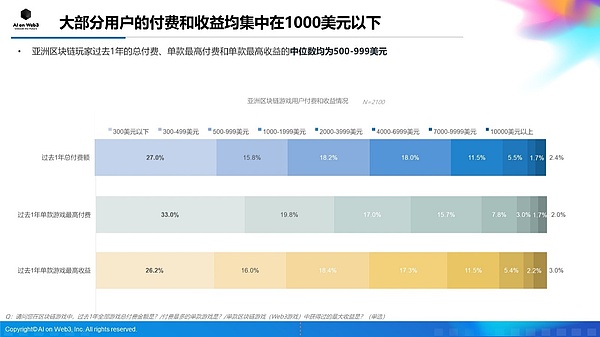
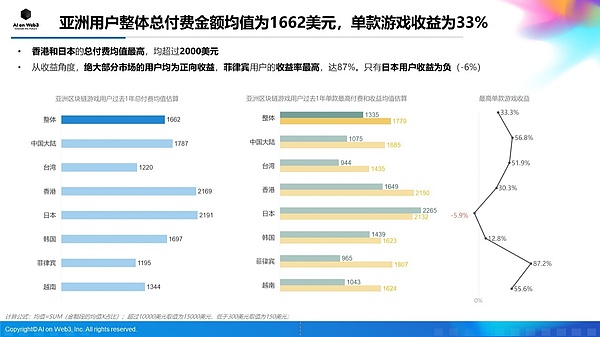
Users purchase frequency slightly higher than sell in terms of transaction frequency and amount of game tokens.Purchase high-frequency operations account for 42% and sold at 37%.Most users’ annual payment and maximum returns for single payment are concentrated below US$1,000.During the transaction process, the factors that users are most concerned about are transaction security (61%), transaction fees (58%) and transaction speed (52%).
(3)tourplayNFT understanding and actionFor preference
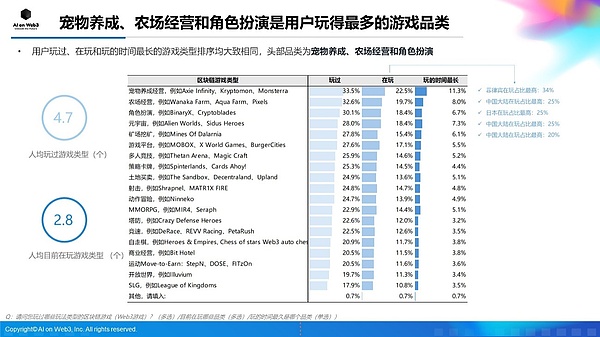
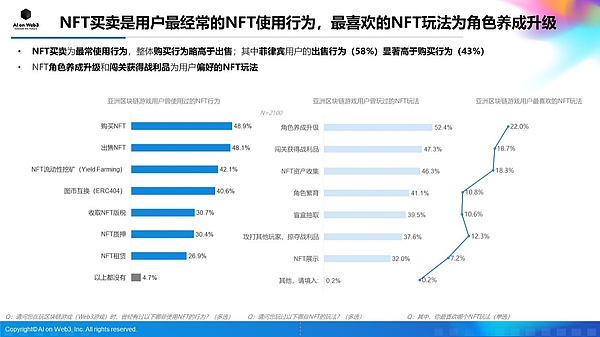
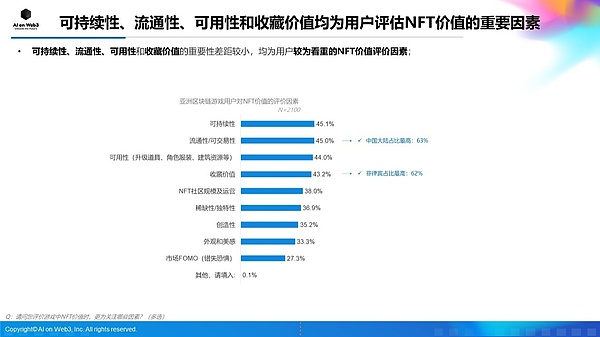
The most common NFT behavior is buying and selling. Character development and upgrading and passing levels to get loot are the most popular NFT gameplay.Users’ evaluation of NFTs mainly focuses on sustainability, liquidity, usability and collection value.
(4)maleChain usage behavior preference
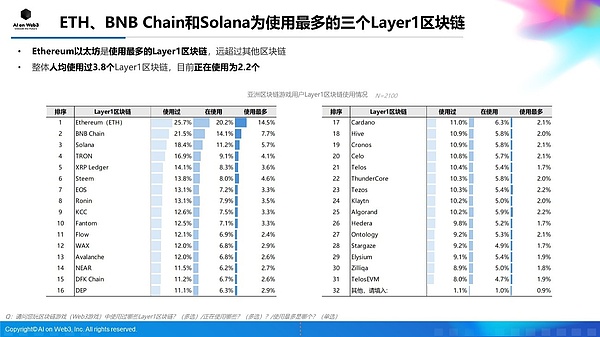
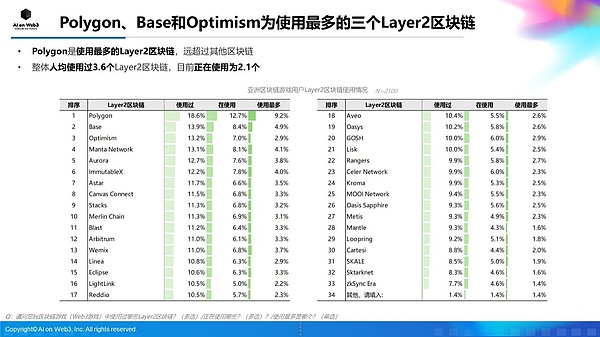
In the use of the Layer1 blockchain, Ethereum (ETH), BNB Chain and Solana are the most popular choices.Users have used an average of 3.8 Layer1 blockchains, and are currently using 2.2.For the Layer2 blockchain, Polygon, Base and Optimism are the most used.Users have used an average of 3.6 Layer2 blockchains, and are currently using 2.1.
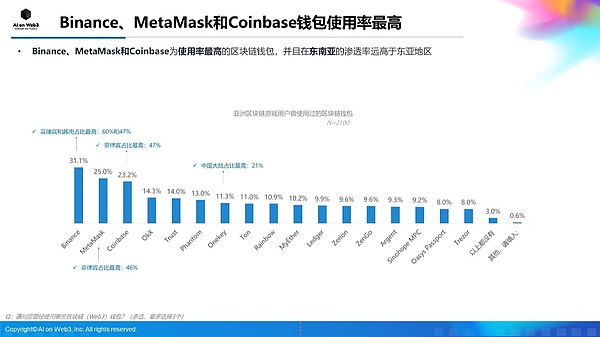
(5)adddenseCoin exchange usage behavior and experience
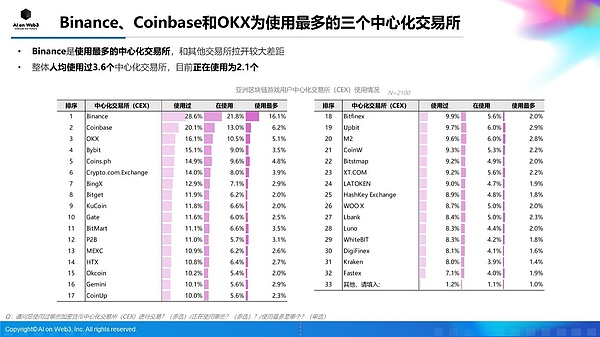
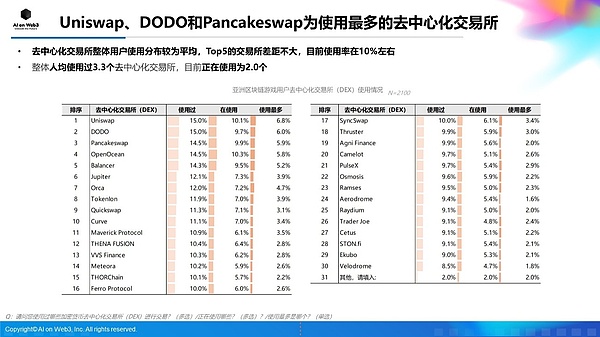
In terms of the use of cryptocurrency exchanges, Binance, Coinbase and OKX are the most used.In terms of decentralized exchanges (DEX), Uniswap, DODO and Pancakeswap are the first choices for users.When choosing an exchange, the most concerned factors users are transaction security (58%), transaction fees (53%) and transaction speed (49%).
(6)KnotDiscussion and suggestions
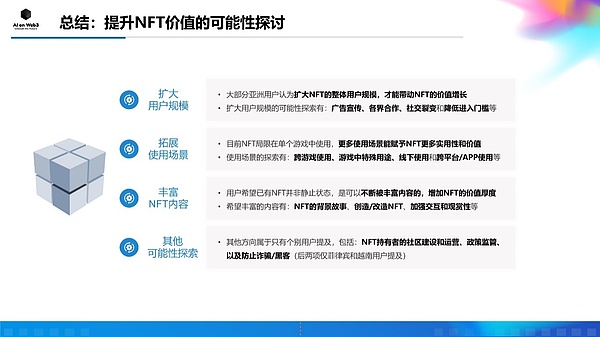
User-suggested improvements include improving game playability, expanding user scale, improving game performance, and maintaining game balance and fairness.In addition, users hope to improve the usage scenarios and enrich content of NFT, including cross-game use, offline use and interactive display.
The report describes the background, behavior, preferences and experience of Asian blockchain game users in detail, and provides comprehensive market insights and suggestions for improvement. We hope to provide an important reference for the development of the blockchain game market.
●Research data description
(1)researchMethods
• DataSpring cooperative sample library is placed in the online questionnaire
• Delivery areas: Mainland China, Taiwan, Hong Kong; Japan, South Korea, the Philippines, Vietnam
(2)PersistenceOKtime
• June 2024
(3)SampleRecycling
• Valid sample: Users who have played blockchain games in the past year are between 18 and 50 years old
• The number of effective samples: 2100 in total, 300 in each market, including 150 in each male and female
●Details of the report
01useHousehold background and game behavior preferences
02tourplaygenerationcurrencyTrading bankforand bodyTest
03tourplayNFTUnderstand and actforNegativegood
04malechainUse rowsforPreference
05adddensecurrencyExchange use rowsforand bodyTest