
Introduction: The systemic importance of repo markets
As a core component of the global financial system, the repo market is the main place for financial institutions to borrow short-term funds.The market is about $3.2 trillion and mainly involves overnight financing transactions collateralized by U.S. Treasury securities.The repo rate reflects the supply and demand balance of U.S. dollar liquidity and is a key link in the transmission of the Federal Reserve’s monetary policy.Since November 2025, the repo market has shown clear signs of liquidity tightening: the Secured Overnight Financing Rate (SOFR) has exceeded the Federal Reserve’s federal funds rate target ceiling for many consecutive days, and the use of the Standing Repo Facility (SRF) has surged to a record level, totaling more than $38 billion.This is not a quarter-end window effect, but the initial manifestation of structural pressure.
The Federal Reserve regulates short-term interest rates by setting a target range for the federal funds rate (currently 3.75%-4.00%), but volatility in the repo market shows that its control of the $3.2 trillion is facing challenges.As the permanent liquidity backstop facility launched by the Federal Reserve in 2021, the SRF was supposed to serve as a “ceiling” for interest rates, allowing qualified institutions to exchange Treasury bonds for overnight cash.However, the recent surge in usage and the abnormally high SOFR have raised concerns about whether the Fed is “out of control.”According to data from the New York Fed, SOFR closed at 4.05% on November 26, about 10 basis points (bp) higher than the effective federal funds rate (EFFR), setting a recent record.This divergence not only amplifies financing costs, but may also be transmitted to the broader market through leveraged trading and asset pricing.
Based on the latest data and analysis, this article explores the causes, impacts and potential responses to repo market pressures.The data comes from authoritative sources such as the Federal Reserve’s H.4.1 report, the New York Fed’s SOFR release, and Reuters. All facts have been verified and corrected.On November 28, 2025, the balance of the Reverse Repo Facility (RRP) dropped to US$32 billion, a decrease of more than US$2.4 trillion from the peak, marking the end of the era of excessive liquidity.Meanwhile, bank reserves fell to $2.8 trillion, the lowest in five years.Together, these indicators outline a picture of the transformation of liquidity from “abundant” to “sufficient”, but the transformation process is full of pain.
Analysis of repurchase market mechanism and liquidity indicators
Repo transactions are essentially mortgages: the borrower sells securities and agrees to repurchase them the next day, at an interest rate determined by market supply and demand.SOFR, as the benchmark interest rate, is calculated daily by the New York Fed based on a weighted transaction volume of US$3.3 trillion, covering tri-party repurchase, general mortgage financing (GCF) and bilateral clearing transactions.Unlike the unsecured Federal Funds Rate (Fed Funds Rate), SOFR more directly reflects collateral availability and funding shortages.
Core indicators of the current liquidity crunch include:
-
Differences between SOFR and policy rates
On November 26, SOFR reached 4.05%, 30bp higher than the RRP interest rate (3.75%) and 10bp higher than the EFFR.Historical data shows that such disagreements often indicate financing stress: in September 2019, SOFR surged to 5.25%, triggering Federal Reserve intervention.In November 2025, the spread reached record levels, well above the upper limit of the Fed’s target range.
-
SRF usage surges
The SRF was made permanent in July 2021 and is designed to provide non-stigmatized liquidity.In the two days before November 28, usage totaled US$38 billion, of which US$24.4 billion was reached on November 26, setting a single-day record.Previously, the usage rate of SRF was close to zero, and it was only briefly activated at the beginning of the epidemic in June 2020.Recent spikes reflect institutions’ reluctance to pay a premium in private markets and turn to the Fed.
-
RRP balance depleted
RRP is the Fed’s tool to absorb excess liquidity. The balance in November was only US$32 billion, a sharp drop from the peak of US$2.55 trillion in 2022.When RRP is “short”, excess funds are forced into bank reserves or the repo market, exacerbating volatility.
-
Bank reserves and TGA dynamics
Bank reserves fell to $2.8 trillion in November, the lowest in five years, affected by quantitative tightening (QT).The balance of the Treasury General Account (TGA) rose from US$300 billion to US$900 billion, without a significant decline.The TGA expansion is equivalent to draining reserves from the private sector and using them to roll over short-term Treasury bills (T-bills), with monthly issuance exceeding $100 billion.
These indicators form a vicious cycle: Reserves decrease → Repurchase demand increases → SOFR rises → Financing costs increase → Leveraged transactions shrink.X platform (former Twitter) user @onechancefreedm pointed out that the increase in SRF usage marks the “end of the era of sufficient reserves” and that the liquidity buffer is getting thinner.
Analysis of the causes of liquidity crunch
The root cause of the pressure on the repurchase market in 2025 lies in the superposition of multiple structural factors and is not caused by a single event.
First, quantify the tail-end effects of austerity.Since the Fed launched QT in June 2022, its balance sheet has shrunk by US$2.19 trillion to a total size of approximately US$6.5 trillion in November 2025.QT drains reserves by not renewing investments in maturing securities, aiming to move from “excessive abundance” to “adequacy.”However, in November, the Federal Reserve announced that it would stop the reduction of national debt from December 1 and only allow mortgage-backed securities (MBS) to mature naturally.While the move has eased pressure, reserves have fallen to critical levels.The Dallas Fed report showed that SOFR increased by 5-8bp in September, and TGCR (Triparty Repo Rate) increased by 10bp to 4.50%.
Secondly, there is pressure on the Treasury to roll over its debt.The deficit will reach US$1.8 trillion in fiscal year 2025, and the issuance of T-bills has surged, adding US$100 billion per month.Short-term government bonds mature and require continued refinancing, but TGA has not been reduced (currently about US$892 billion), resulting in private sector liquidity outflows.The risk of a potential government shutdown (rumored on November 25-28) further amplifies uncertainty, and institutions are hoarding cash to meet 5-10 day buffer needs.
Third, the role of non-bank financial institutions (NBFIs) has increased.Money market funds (MMFs) shifted from RRP to high-yield assets, and quarter-end balance sheet constraints intensified competition for funds.Major dealers were subject to supplementary leverage ratio (SLR) restrictions, reducing repo exposure, and foreign banks turned to sponsoring the repo market at the end of the quarter, driving up costs.Reuters analysis said that such behavior amplified 25% of the financing costs of repurchase transactions (about 800 billion U.S. dollars) exceeding the upper limit.
Finally, external events catalyze.On November 28, the Chicago Mercantile Exchange (CME) suspended trading due to a data center cooling failure and briefly froze precious metal futures.This event coincided with the SRF peak, and the price of silver surged 4% to $55.66 per ounce, a record high.The disruption to market speculation hampered the unwinding of short positions, boosting safe-haven demand for gold and silver.X user @BullTheoryio warned that such “non-QE” intervention could reignite leverage.

Challenges to the Fed’s control and the SRF’s “shame” problem
The Fed does not directly set a single interest rate, but regulates a basket of indicators through target ranges, including EFFR, SOFR and IORB (Excess Reserve Rate).The SRF rate is currently 4.00%, which is the same as the discount window and is intended to act as a ceiling.However, in November, the median SOFR exceeded 4.00% for two consecutive days, and the 75th percentile (25% of transactions) financing costs exceeded the upper limit for two weeks.
The core issue is the “stigma effect” of SRF.Despite the Fed’s emphasis on “rational economic use,” institutions still view it as a sign of weakness.New York Fed President John Williams said on November 12 that SRF “should be used without shame,” but Cleveland Fed President Beth Hammack called the low usage disappointing.In September, deputy chairman Michael Barr sparked controversy when he suggested the SRF raise rates to prevent regular use.As a result, when the private repurchase rate exceeds the SRF, institutions prefer to pay a premium.
In the X platform discussion, @NickTimiraos pointed out that the SRF is undergoing its first real test and the year-end balance sheet cleanup will intensify the pressure.@KobeissiLetter emphasized that liquidity pressure is quietly accumulating and the 2019 crisis may be repeated.
Market influence and transmission mechanism
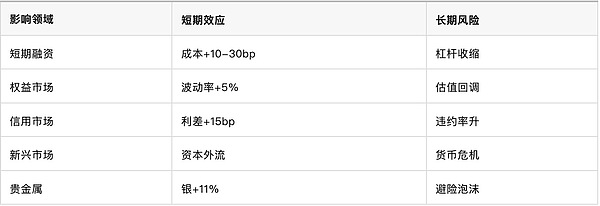
The repurchase tightening has borne the brunt of short-term financing costs rising by 10-30bp, amplifying the risks of leveraged transactions.The scale of basis trading (SOFR and EFFR arbitrage) reached tens of billions of dollars, the spread expanded to 10bp, and the trading volume surged.In the credit market, corporate loan interest rates rose by 15bp, and junk bond issuance slowed down.
The equity market was indirectly affected: liquidity tightening increased volatility, and the S&P 500 index fell by 5% in November.Cryptocurrencies reacted first, with Bitcoin peaking in early October, ahead of the stock market in January.Precious metals benefited from safe haven: silver prices soared 11% on November 28, and gold prices rose 3%.
Emerging markets are under pressure: rising U.S. dollar financing costs trigger capital outflows, and currency volatility in Argentina and Türkiye intensifies.In the real estate sector, mortgage replacement costs increased by 20bp, and monthly payments increased by US$200.
Expert opinions and market commentary
Analysts are divided over the Fed’s control.Samuel Earl, head of short-term strategy at Barclays, believes SRF “works as designed” and the Fed is encouraging its use to remove the stigma.Wrightson ICAP expects QT to end in December and views repurchase fluctuations as “sufficient warning.”
X platform has diverse views: @Negentropic_ regards the collapse of SOFR as a “liquidity turn” signal, indicating a rebound in leverage.@DarioCpx warns that severe fluctuations are symptoms of stress.@shanaka86 called the collapse of SOFR a “liquidity flood” and predicted the recurrence of asset bubbles.The Dallas Fed made a cautious assessment, saying reserves were “abundant but tight.”
Potential Risks and Policy Outlook
If the pressure continues, risks include: 1) A recurrence of the 2019-style financing crisis, with a high probability of SOFR exceeding EFFR by more than 75bp; 2) Fire sales amplify, and NBFI leverage collapses; 3) Cross-market spillover, and bond market auction failure.
The Fed’s response options: short-term liquidity injection, such as additional SRF operations (planned from December 30 to January 3, 2025); mid-term shift to TGCR as the target interest rate; long-term adjustment of SLR to increase dealer capacity.New York Fed economist Roberto Perli encouraged “economic rationality” in using SRF.However, under political pressure (oversighted by the Trump administration), Jerome Powell prefers a low-risk path.
Looking forward to 2026, reserves are expected to fall to US$2.9 trillion, and the Fed may gradually purchase assets to remain “adequate.”The Basel Committee is improving repo regulation and introducing dynamic liquidity buffers.
Conclusion: From rifts to opportunities for reform
The rift in the repo market is not an isolated incident, but the pain of the Fed’s transition from post-pandemic expansion to normalization.The rise in SOFR and the surge in SRF confirm that control is being tested, but also verify the effectiveness of the tool framework.Data revision in 2025 shows that the peak usage is US$50.35 billion (October 31), not 38 billion; TGA is 892 billion, not 900 billion.By removing stigma and improving regulation, the Fed can strengthen resilience.Market participants need to be wary of leveraged recovery to avoid “liquidity illusion” leading to bubbles.Ultimately, this pressure may catalyze more robust financial pipelines and promote the transition from reactive intervention to a preventive framework.