Author: Digital Asset Research, Compiled by: Shaw Bitcoin Vision
The cryptocurrency market is extremely divided right now.While some are shouting “The bear market is a foregone conclusion and a crash one year after the peak is imminent,” others are paying attention to real market signals.
I belong to the second opinion, and today I will explain to you why this decline is not the beginning of a terrible long-term bear market, but the last major low of the entire cycle.
I’ve used the same tools to predict every major bottom in this cycle, and now that prediction is ringing louder than ever.
While most people are still stuck in the overly simplistic “four-year cycle” mindset and ignore other aspects, you also know that it’s the longer, more dominant cycles that really control the situation.
There’s nothing wrong with the four-year cycle per se, it’s just a very small cog in a huge machine that most people don’t even see.
Context is crucial.Conditions are crucial.And now, every layer of Gann analysis we rely on——Time cycles, market structure, price levels, seasonal turns, and perfect time/price squares – all point to the same conclusion – we are at an inflection point.
Let me prove it with five interlocking pieces that have never let us down this cycle.
-
The cycle of 7 comes from all angles (7 years, 7 months, 7 weeks, 7 days)
-
Market structure is actually strengthening, not weakening.
-
The Gann price level (0.375) has captured every major low in this cycle, and this price level is the corresponding point for all important lows in this cycle.
-
This week brings together a series of seasonal anniversaries and the 225°/45-day turning point.
-
Multiple time/price grid charts accurately mark the dates and price ranges we just marked.
This is not hope or speculation, but the result of a perfect fit between market structure and time, and this fit will only appear at the most important turning points.
The market has accomplished its mission: weeding out shaky investors, completely reversing market sentiment, and convincing 90% of participants that the bull market is over.This is exactly what the market should do before the real move begins.By the time you finish reading this article, you will, like us, see the current low as a turning point that will lead Bitcoin’s cycle into 2026.
The cycle of 7
The first thing to consider is the 7-year cycle, which can be broken down into 7-month, 7-week or 7-day cycles.Having previously shared similar views on Ethereum’s cycles, we will now explore Bitcoin’s cycles.
The image below is one of Gann’s cycle laws and explains why the number 7 is so important in the market.
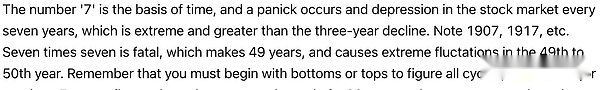
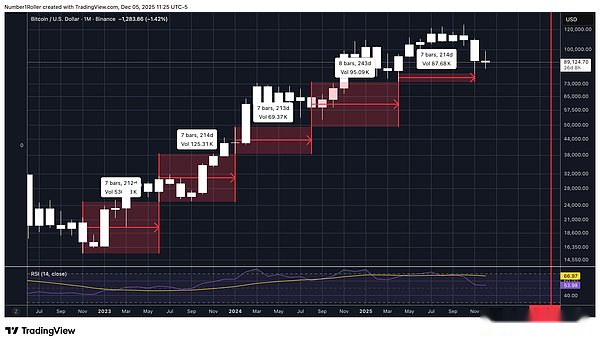
We can look at the monthly chart to see how this is going.
As shown below, 84 months equals 7 years, and every 84 months we experience a significant low.Taking 42 months as the midpoint of the cycle, it also shows a cyclical fluctuation from low to low.
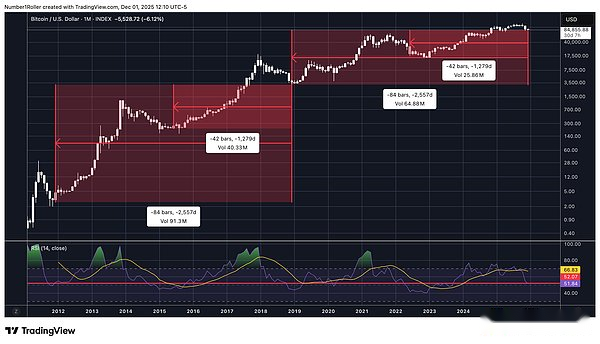
When we zoom in and look at this cycle, we can also measure the range of time intervals from monthly low to monthly low, and we find that each monthly low occurs exactly 7 months from the previous major low.
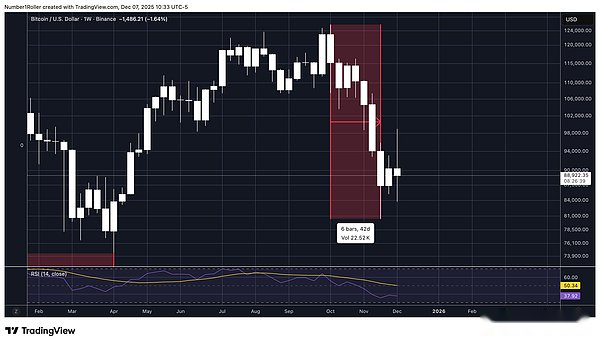
Finally, from the perspective of the weekly cycle, the market did fall for 7 weeks (45 days). Gann theory believes that during this time period, the daily and weekly adjustments will reach their peak during this period, so close attention is needed.
To summarize, we can see that the 7 periods from monthly to daily are converging together, indicating that this is an important turning point for this market.
Market structure and price levels
Many people talk about market structure, higher highs and lower lows, but few truly understand it.It’s the same as those who only know about the four-year cycle, that’s all they know but don’t really understand the cycle and what it means.
Those who believe that this market structure has turned into a bear market actually do not understand what market structure is and do not know how to judge it.
Gann theory always emphasizes that the most important indicator of trend change is time.
In a bull market, prices tend to rise longer than they fall.Not only that, the market will not fall longer than the previous decline..This is what we call the equilibrium period.
When the duration of a market decline continues to shorten, the market sends a strong signal.
Looking at the duration of pullbacks in this cycle, they have been getting shorter and shorter, suggesting that the trend is not signaling a change and that the market is actually showing strong momentum.
Next we can talk about price adjustments.The following is an excerpt from “45 Years on Wall Street” by Gann.
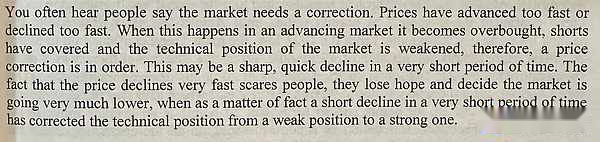
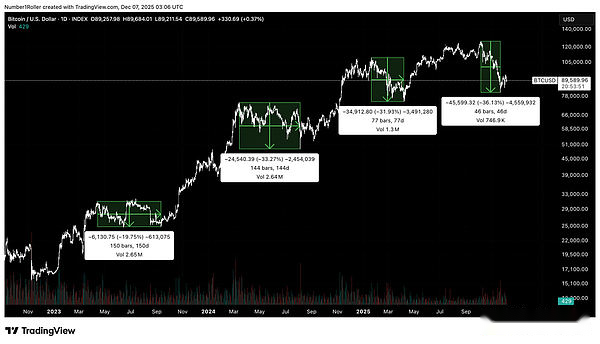
It is precisely this that has been overlooked in this latest pullback.Looking back at the previous Bitcoin cycle, you will find that as the cycle progresses, the price fluctuations of the correction become more and more violent, but the duration becomes shorter and shorter.This indicates a strong market and increasing volatility as it approaches its peak.
The chart below shows that this is exactly what is happening in this structure, with the pullbacks getting stronger but shorter in duration.
price level
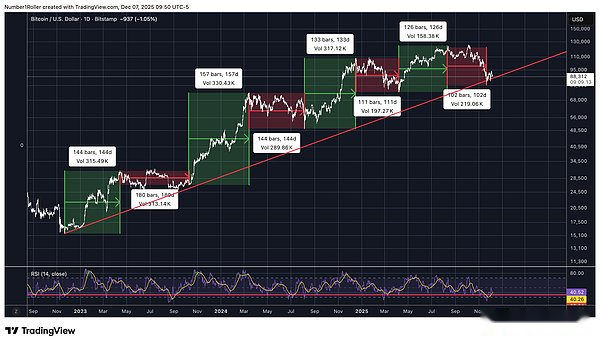
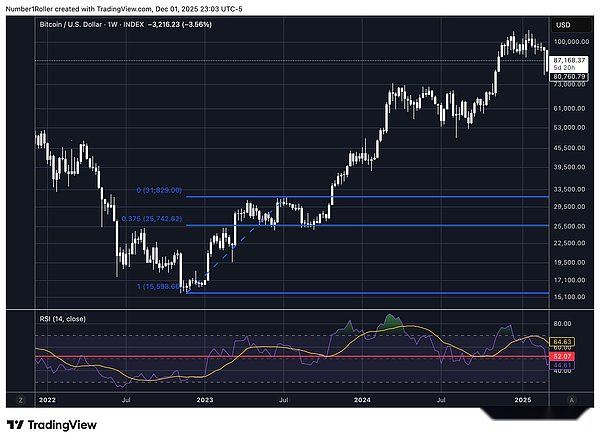
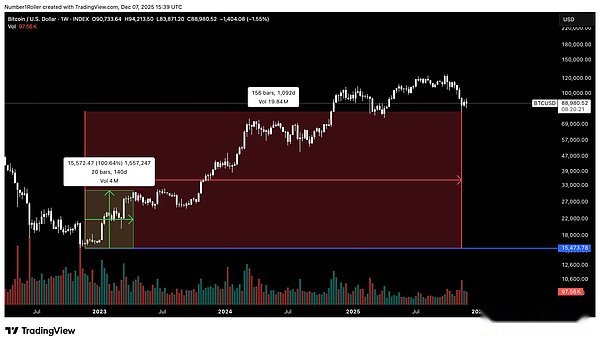
Measuring price pullbacks from the cycle lows, there is one key support level that has remained constant throughout the cycle and plays a significant role at each low.
This level is the 0.375 Gann level.Gann divides price movements into eight equal parts rather than using typical Fibonacci levels.
In this case, we can see that this level has marked the bottom of every major high from 2023 to present day.
2023 highs
2024 high
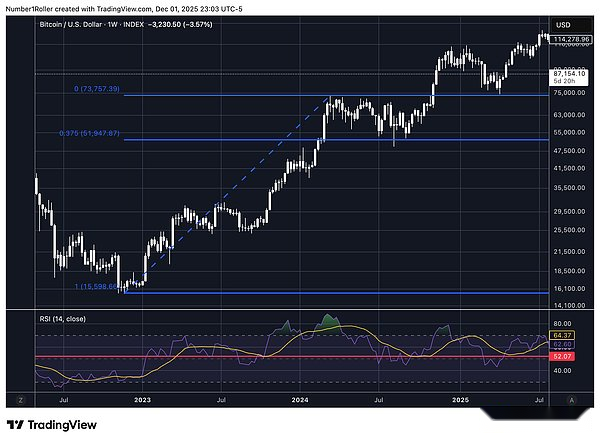
January 2025 high
October 2025 High
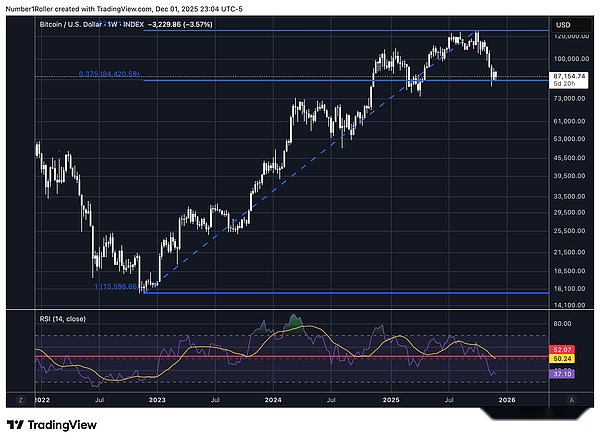
Every time the price touches this level from a significant high, it eventually bottoms out.This time, the level appeared at 84,420 and the price stabilized and closed above its levels on the weekly chart.
seasonal pattern
Next we need to consider some seasonal factors.
The first is the high that occurred on December 17 last year.It’s a 360-degree date and an anniversary that will happen again this December 12th.
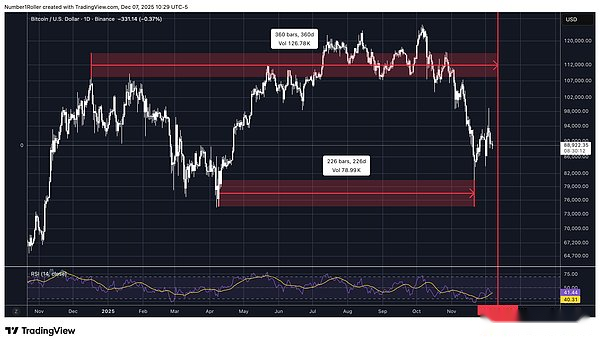
This also shows us a low that occurs at an angle of 225 degrees from the April low, and according to Gann theory, this marks the arrival of a seasonal turning point.
If the year is divided into eight equal parts as Gann did, the year will be divided into eight 45-degree intervals.
So not only do we have 225 days to see a change in trend, but this date is 45 days away from the October high.

Finally, I want to take another look at what I consider the 15-year cycle because it will be significant in 2026.
During that cycle, we hit the low the week of December 6, 15 years ago.
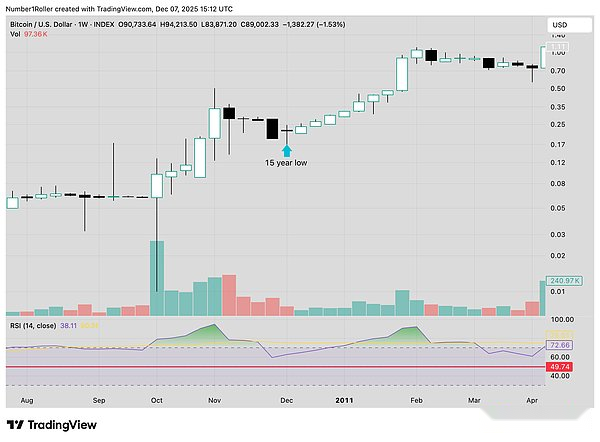
Recently, we have seen a reversal in this major cycle, but if we want to get back on track, a low in this time frame is reasonable.
We collectively reached a significant anniversary in early December last year, coinciding with annual seasonal patterns that suggest a reversal may be imminent, coinciding with the 180-month cycle.
The square relationship between time and price
Measuring time frames, degrees, and seasonal timing will get you 90% correct in identifying major turning points, but this analysis only really holds up when timing and price coincide with all of these factors.
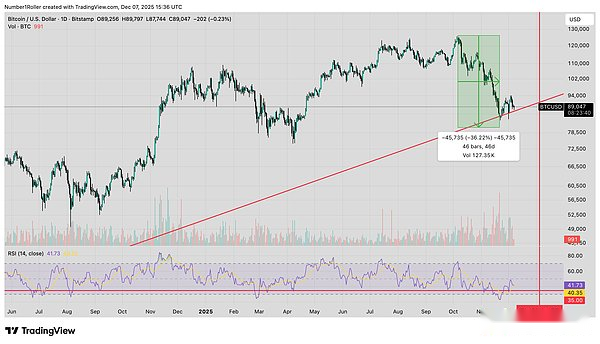
We know that price and time reached equilibrium on the way down, down 46,000 in 46 days, so we have a strong reversal point at the 1/1 angle on the daily chart.
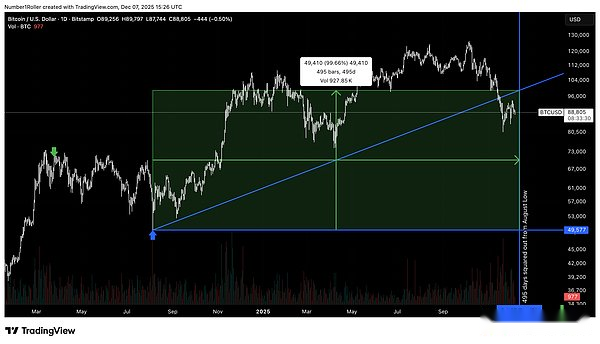
We can further strengthen this squared relationship by looking back to the August 2024 lows.The low occurred at 49577 points.If you extrapolate 495 days forward from that low, you get December 13, which is just one day away from last year’s top and seasonal timing.*Note that the midpoint of this square occurs exactly at the April bottom.
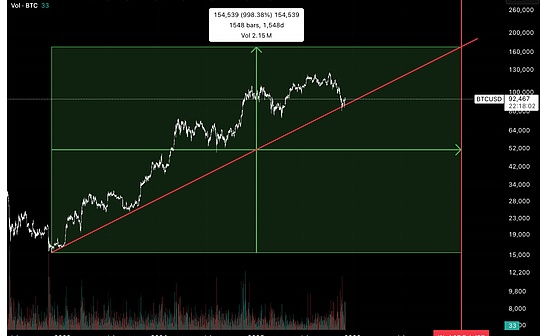
Next, if we look at squaring some higher time frames from the cycle low at 15480, pushing forward 1548 days and up 154800 points, we get the line shown below which squares time and price from the cycle low.
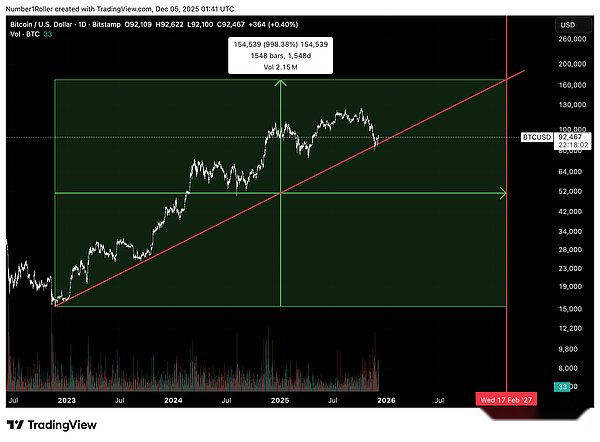
Additionally, I want you to note the importance of cycle lows.
Notice how the price of 15,480 started the first range of the upward move from the bottom of 15,500 points.
You will constantly notice the interplay between price and time.Therefore, looking ahead 155 days, 155 weeks and 1550 days is critical.It is worth noting that the most recent low occurred at week 156, the penultimate week of the three-year cycle, which also happens to be the anniversary of the November 22 cycle low.
Conclusion
This is not a theory or wishful thinking.
What I have just described is the perfect combination of Gann time cycles, price squares, anniversaries, seasonal turning points, and unbreakable market structure that have accurately predicted every major low in this cycle without exception.
As the market always does at true bottoms, it goes extremely bearish, convincing almost everyone that things are over, and then shakes off all the weak hands that can.
-
The structure is still intact.
-
The key Gann price level was equal to the actual traded price.
-
Time periods ranging from 7 days to 15 years have converged.
-
The time/price square chart accurately predicts deal dates and amounts.
This is no coincidence.
The market has bottomed out.Anyone still predicting a multi-month bear market is going to be hit hard..
Those who believe in the four-year cycle theory, those who preach that “higher highs/higher lows have been broken” and those who are always bearish are once again on the opposite side of the market.
We have seen this kind of drama before and know how it ends.The evidence is clear, right before our eyes—this is the last big low.