Author: Michael Zhao, Grayscale; Compilation: Baishui, Bitchain Vision
-
Bitcoin has always shown cyclicality and has obvious “bull market” and “bear market” stages.
-
The current bull cycle of Bitcoin appears to be driven by a variety of technology drivers, such as inflows of spot Bitcoin ETFs, as well as strong fundamental factors such as active inflows of stablecoins and increased locked-in total value (TVL) in DeFi applications.
-
Bitcoin’s cyclical indicators show that we are currently in the middle of the bull market (in baseball metaphor, probably around the fifth inning), and based on the current trend, there is still room for continued growth.
-
Given a series of positive fundamental developments, the bull market may continue.However, investors may want to stay alert by monitoring spot Bitcoin ETF traffic and macroeconomic indicators to spot signs of market changes.
Are we in a bull market?
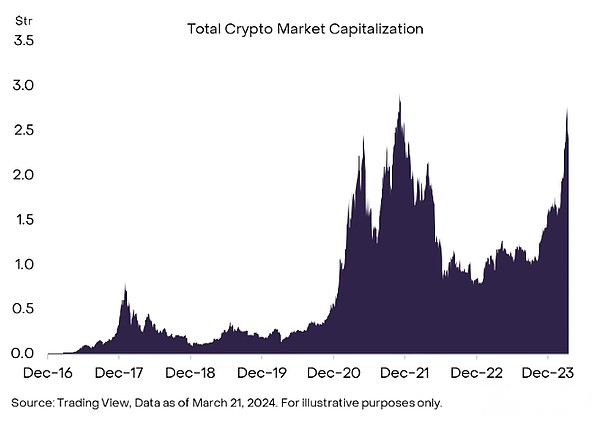
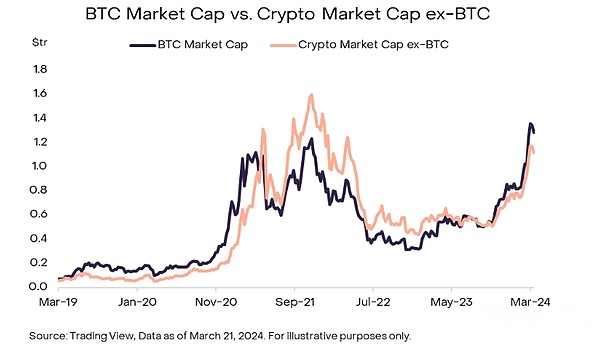
Bitcoin prices soared rapidly, breaking through several record highs in the United States.Bitcoin has rebounded rapidly from its 2023 lows over the past month.Of more than 30 currency pairs, Bitcoin has reached record highs even earlier.This recovery has attracted the attention of the news media, and there are reports on the price trend of Bitcoin every day.But that doesn’t seem to stop there:Traditional investment managers even began analyzing meme coins in their research notes — a clear sign of growing mainstream interest in cryptocurrencies in history.As the overall cryptocurrency market capitalization approaches its all-time high (Chart 1), we must ask ourselves: Are we witnessing the beginning of a new bull market?
Chart 1: Total cryptocurrency market value approaches historical high
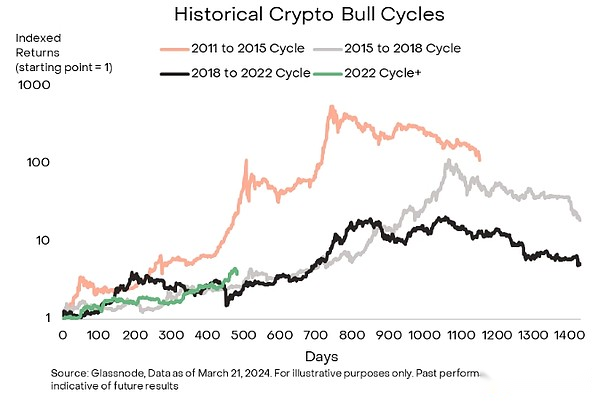
First, let’s clarify the meaning of the bull market.Although the exact definition can be difficult, a practical approach isThink of a bull market as a cycle of about three to four years starting from the lowest price point of the previous cycle(Figure 2).Typically, these cycles are characterized by a gradual rise in prices, peaking at cycle highs, and then a period of stable or slightly decline.
Chart 2: Visualization of the Bull Cycle Cycle
Identifying elements of a bull market can be challenging:What factors drive us to this point?What can we expect in terms of duration and sustainability?
Prerequisite: Bitcoin’s dominance is growing
Historically,The beginning of a cryptocurrency bull market is often marked by the surge in Bitcoin’s “dominance”, an indicator of the value of Bitcoin relative to the entire cryptocurrency market.This trend underscores the role of Bitcoin as a leading indicator for the broader crypto market.Normally,Bitcoin’s rise precedes the wider rise in altcoins.Inspired by Bitcoin’s profits, investors may risk entering riskier cryptocurrencies in search of greater returns.This dynamic can be observed during the 2021-2022 bull market, during which Bitcoin’s rise quickly led to a significant increase in altcoin valuations (Figure 3).
Chart 3: Bitcoin’s rise often precedes the altcoin rise
While the current cycle demonstrates a familiar pattern of Bitcoin’s growing dominance, paving the way for an altcoin rebound, the notable factor for this cycle is its unique catalyst.As we discussed before,Key drivers such as spot inflows of Bitcoin ETFs and enhanced on-chain liquidity not only contribute to the current bull market momentum, but also mark a divergence from traditional dynamics observed in previous cycles.
Catalyst #1: Spot Bitcoin ETF Traffic
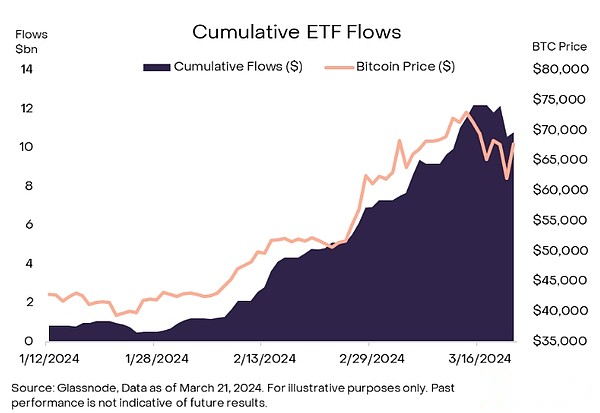
Compared to the previous bull market, the first key difference in this bull market is the rapid change in positive market dynamics, which is largely affected by the inflow of spot Bitcoin ETFs.Since the ETF was approved in January, these inflows have been more than three times the Bitcoin issuance by mid-March, which puts upward pressure on prices (Figure 4).
Chart 4: Cumulative inflow of spot Bitcoin ETFs drives up Bitcoin price
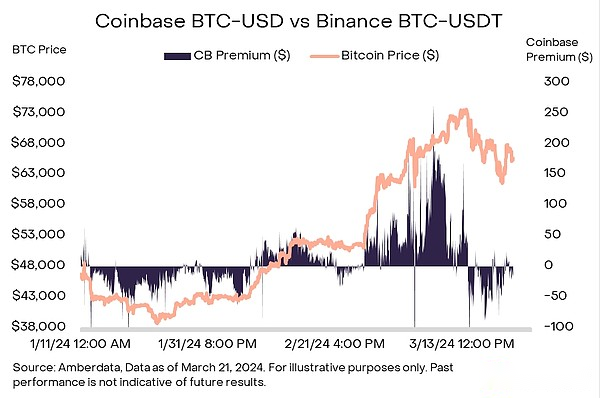
At a higher level, when new shares of spot Bitcoin ETFs are created, the ETF needs to purchase Bitcoin from the spot market and deliver Bitcoin to the fund.In other words, creation leads to the increase in the need to buy Bitcoin to match the fund’s assets.in short,Cash needs to be converted to Bitcoin based on the creation of the primary market.This dynamic is evident when analyzing the hourly premiums of Coinbase BTC-USD vs. Binance BTC-USDT (Figure 5).Coinbase’s higher premium indicates increased spot buying pressure for U.S. investors, an indicator of ETFs’ presence in market dynamics.
Chart 5: Coinbase (CB) BTC-USD has a premium relative to Binance BTC-USDT, indicating buying pressure in the United States
Catalyst #2: Healthy on-chain basic indicators
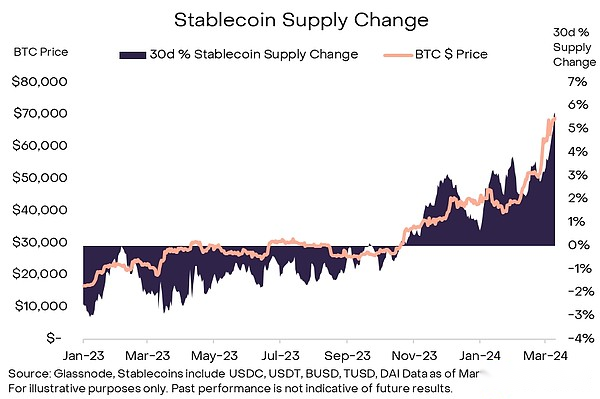
On-chain indicators also indicate that liquidity is increasing.A key indicator of on-chain data is the positive shift in stablecoin inflows.Stablecoins are digital currencies pegged to stable assets such as the US dollar and play a vital role in the cryptocurrency ecosystem.They are designed to provide a stable medium of trading and serve as the main basis pair for trading on most centralized and decentralized exchanges.
The increase in stablecoins liquidity means more funds can be used for trading, whether it is buying or selling cryptocurrencies.As the increasing exchange stablecoin reserves suggest,The influx of stablecoin capital usually drives bull market momentum(Figure 6).
Chart 6: Stablecoin inflows are related to BTC price
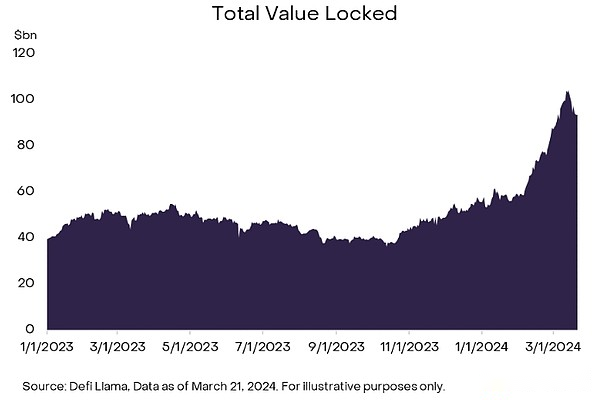
Relatedly, on-chain liquidity also appears to be a significant increase, as evidenced by the total locked value (TVL) in decentralized finance (DeFi) applications (Figure 7).TVL summarizes the total value of assets stored in various DeFi protocols and serves as another indicator for evaluating ecosystem liquidity.The increase in TVL not only means an increase in liquidity within the DeFi platform, but also indicates a growing user engagement with the ecosystem.Increased liquidity is essential to the vitality of DeFi and helps promote smoother trading and wider financial activity.Given basic on-chain activity, it is worth noting that TVL for decentralized applications has more than doubled since the beginning of 2023, when TVL was about $40 billion and reached about 1,000 by mid-March 2024.$100 million.
Chart 7: The total value of DeFi locks has more than doubled since 2023
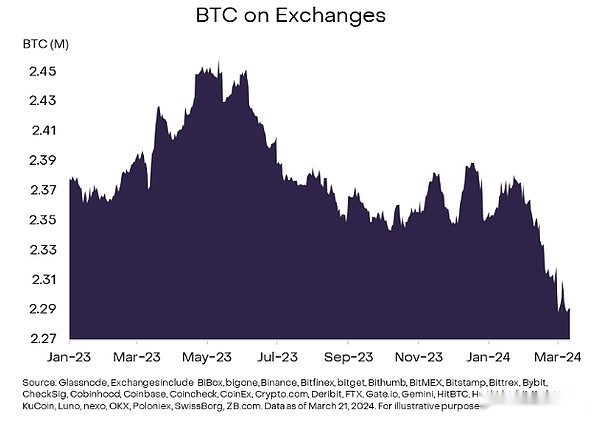
also,Exchanges hold significantly less Bitcoin, 7% decline since the local peak of Bitcoin supply in May 2023, suggesting tight supply, partly due toSpot Bitcoin ETF transfers BTC to custodial cold wallet for long-term storage(Figure 8).According to Glassnode’s research, the total BTC held by the exchange has shrunk to about 12% of the circulating supply, the lowest level in five years.This situation away from exchanges has traditionallyIt is seen as a bullish indicator, indicating that people tend to hold rather than sell, and investors’ confidence in the value of Bitcoin.As demand on exchanges gradually outweighs supply, the subsequent liquidity tightening not only highlights the influence of these spot Bitcoin ETFs, but also strengthens the market’s bullish outlook for the cryptocurrency market.
Chart 8: Bitcoin supply drops on exchanges
Entering the middle of the bull market
Now that we have identified the drivers of the bull market, we need to evaluate our position.Although each cycle has its inherent uniqueness, the established on-chain pattern and sentiment data make us believe thatWe are currently in the “middle term” or “fifth inning” of the current bull market cycle.Despite the progress we believe there is still room.
Market Value/Achieved Value + Unrealized Net Profit and Loss
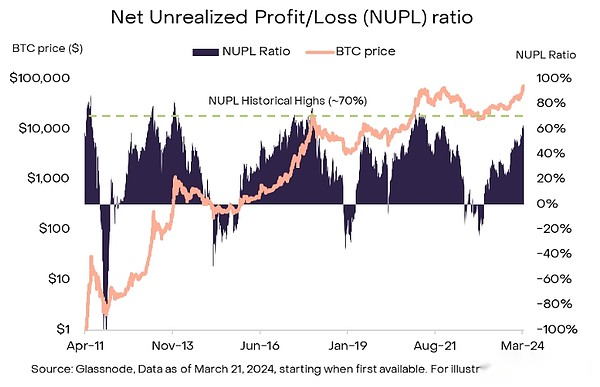
The Market Value/Achieved Value (MVRV) metric compares the market value of Bitcoin to the “Achieved Value” or the price of all Bitcoins when the last time they changed hands.Using this difference, net profit and loss (NUPL) is calculated by dividing the difference between market value and realized value by market value.As Bitcoin prices rise and investors who buy at lower costs remain holding Bitcoin, the NUPL ratio rises.As of mid-March 2024, NUPL was about 60%, with historical peaks at a margin above 70%, and it seems we may be approaching the cyclical highs of this indicator (Figure 9).
Chart 9: NUPL reaches historical cycle highs
MVRV Z-Score
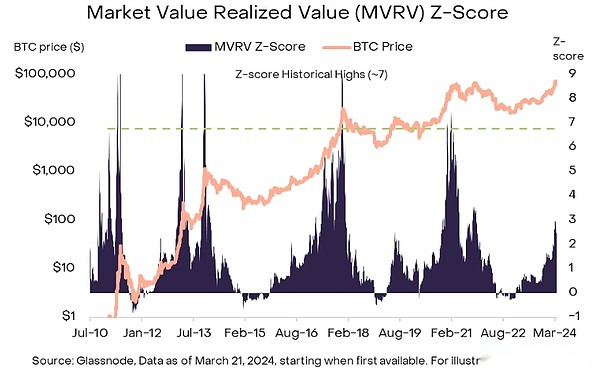
Instead, MVRV Z Score offers a different perspective, demonstrating the potential for further growth.This indicator calculates the difference between market cap and realized upper limit and adjusts volatility based on the rolling standard deviation of market cap.Historically, the high Z score reflects a huge gap between market value and realised value, marking the peak of the cycle.at present,The Z score is about 3, which is much lower than the previous cycle peak level, and there seems to be a lot of room for upward(Figure 10).
Chart 10: MVRV Z scores indicate we are not close to the peak of the bull market yet
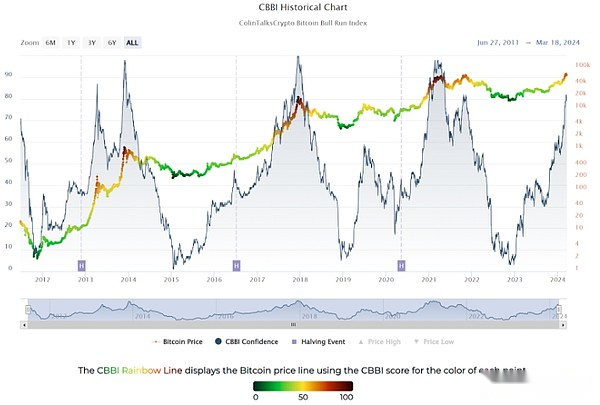
ColinTalksCrypto Bitcoin Bull Index
From a broader perspective, the ColinTalksCrypto Bitcoin Bull Index (CBBI) provides a comprehensive perspective by combining nine different ratios into a single number that measures progress in the bull market phase (Figure 11).These ratios cover a variety of values, including Bitcoin’s price relative to its historical performance, on-chain indicators that indicate investor behavior, and broader market sentiment indicators.By integrating data from sources such as MVRV Z scores, Puell multiples and RHODL ratios, CBBI aims to provide snapshots of a wide range of market conditions.As of mid-March 2024, the CBBI was 79 (out of 100), indicating that we are approaching the peak of the cycle, although the market still has the potential to further up.
Chart 11: CBBI shows that we are closer to periodic peaks
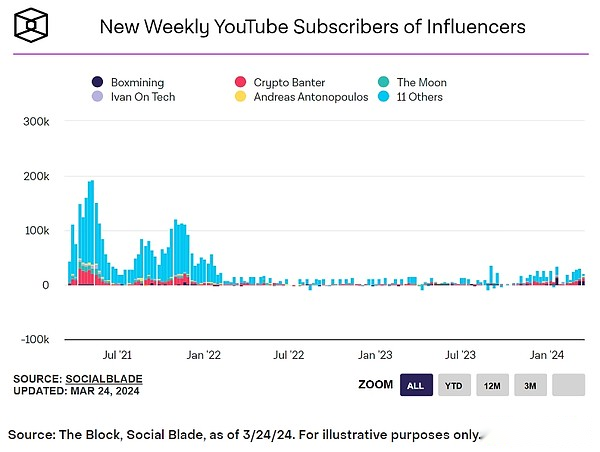
Retail market sentiment
However, the emotional data presents a completely different picture.The subscription rate of cryptocurrency-related YouTube channels can be used as an indicator of retail investor interest, but its subscription rate is significantly lower than the enthusiasm during the 2020-2021 bull market.However, the recent rise in subscriber growth rates suggests that retail investors’ interest is growing slowly(Figure 12).
Chart 12: Cryptocurrency Youtube Subscriptions Still Low
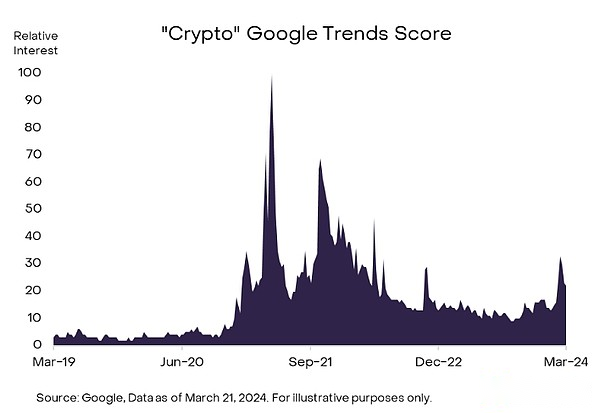
same,The search interest level of the term “cryptocurrency” on Google Trends is significantly lower than its peak in 2021, suggesting that the broader public curiosity about cryptocurrencies may not have fully rebounded yet(Figure 13).Google Trends shows how popular the search terms are by giving them a score from 1 to 100 (the Y-axis).This score is based on Google search samples, randomly selected and unbiased.Score 100 means a term is at its highest popularity at the selected time and place.This difference has raised questions about retail investors’ participation in the current cycle.
Chart 13: “Cryptocurrency” search popularity declined compared to the previous cycle
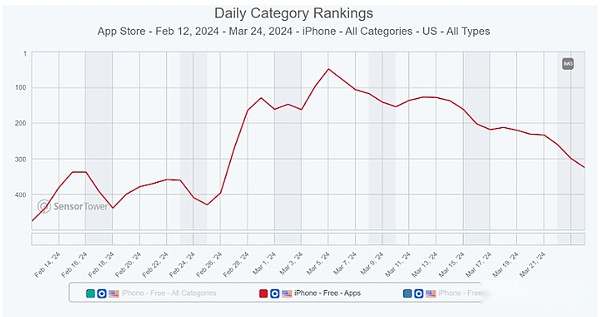
Mobile engagement measured by the Coinbase app downloads appears to indicate a growing interest among potential investors and peaked at the top 100 around March 5 (Figure 14).However, its subsequent decline in rankings suggests that the platforms used by market participants may cool down or change.
Chart 14: Coinbase app rankings hover around 300
In order to coordinate the rising price/on-chain indicators and the sluggish retail sentiment, it can be consideredRetail investors driving the previous cycle have not yet fully re-entered the market.In our research,The momentum of this cycle may be driven by different types of investors – investors less obvious on social media platforms like Twitter or YouTube.The approval of spot Bitcoin ETFs may attract investors who are more at ease with traditional investment tools.This shift suggests that Bitcoin has gained wider acceptance and may expand its appeal beyond typical cryptocurrency enthusiasts, including those who prefer mature financial products.
The future catalyst for the bull market
The results of the bull market have not been determined yet.Nevertheless, we remain cautiously optimistic, boosted by potential catalysts such as increased retail and institutional participation, which may help drive the momentum of the cycle.
One thing we are cautious about is the behavior of new Bitcoin ETF spot buyers.Historically, Bitcoin does experience a pullback in every bull cycle, so we are not sure how these new buyers will react when facing a pullback.Encouragingly, the cycle has experienced a relatively small retracement so far (Figure 15); the retracement amount is the smallest compared to the past cycle.
Chart 15: The current bull market cycle has the minimum amount of retracement
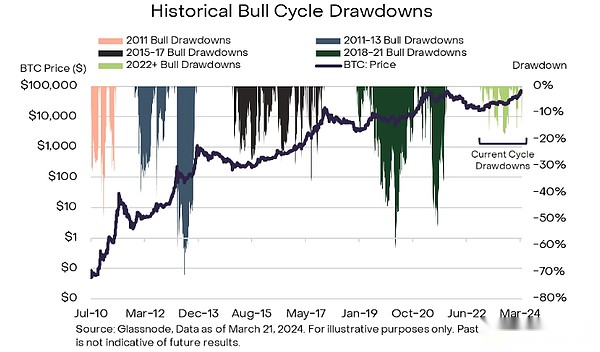
On the other hand, we recognize that there is an untapped need.Apart from the aforementioned retail investors who have not yet returned to the market, some institutional investors (such as telecom companies and wealth management companies) are still on the wait-and-see state.However, a specific organization has begun to approve the inclusion of spot Bitcoin ETFs into an advisor-managed portfolio.This cautious but hopeful recognition marks a huge but untapped investment potential that we believe can sustain or accelerate the market’s upward trajectory.
Summarize
Spot Bitcoin ETF traffic and macroeconomic indicators are currently the main forces that determine the near-term direction of the Bitcoin bull cycle, just like the two sides of the seesaw, whose influence fluctuates over time.At some moments, spot Bitcoin ETF traffic dominates, while at other moments, macroeconomic factors dominate.This ever-changing dynamic ensures that our attention is always focused on these elements, as they are likely to continue to dominate the narrative of Bitcoin market behavior.
Looking ahead, our belief in the performance of Bitcoin as an asset class remains unwavering.Supported by favorable market conditions and its established role as a store of value and hard currency, we believe Bitcoin will continue to succeed.Although the market rose strongly in early 2024, investors must remember the inherent volatility of cryptocurrencies, characterized by cyclical retracement in bull markets.However, by maintaining a long-term perspective,We believe Bitcoin is clearly in a strong position.