
Author: Kevin, Movemaker Researcher; Source: X, @MovemakerCN
As Ethereum breaks through 4868, it officially reaches a record high. Looking back at the market trends in the past two weeks: Ethereum has experienced a roller coaster of 4788-4060-4887, and a 15% decline and a 20% increase are completed within 10 days. The stock prices of institutions that promote this round of Ethereum market, namely Ethereum MicroStrategies, are also experiencing a roller coaster market.
 If your portfolio contains Ethereum and its leveraged institutional stocks and foresee that Ethereum will fluctuate widely at historical highs, the importance of how to use derivatives to resist the risk of account retracement is increasing.Even if you are a long-term holder of “buy and hold”, you may not want to experience another ultra-long downward fluctuation of Bitcoin last year on Ethereum.
As a nonlinear financial derivative, options provide an effective solution to managing this price risk.By purchasing put options, you can set a price lower limit for the ETH or related coin assets it holds, thereby protecting the value of its portfolio when the market falls sharply.Going further, by building more complex options portfolios, you can even make profits from market consolidation or small fluctuations.
How to do more mNAV if you are optimistic about the flywheel expansion?
Ethereum’s DAT flywheel is still ongoing
DAT (Digital Asset Treasury) strategy has enabled Michael Saylor’s company’s market value to exceed $100 billion, and its growth in the same period even surpassed Nvidia.By issuing securities of the company (such as stocks or bonds), raising funds from the open market, and then using funds to increase their holdings of crypto assets on a large scale, aiming to create a positive cycle of “fundraising -> Buying coins -> Coin price and stock price rise -> Fundraising again”.
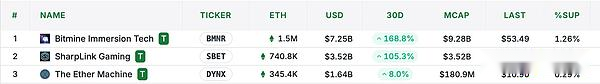
Companies represented by Sharplink Gaming (SBET) and BitMine (BMNR) are trying to replicate and upgrade this model, and the unique nature of Ethereum may make the flywheel spin faster and more stable.
The essence of the DAT model is an arbitrage game about the long-term growth rate of assets and financing costs.The premise of its success is that the long-term compound annual growth rate (CAGR) of underlying assets (such as ETH) must be significantly higher than the company’s capital cost.However, the special thing about Ethereum treasury is that it does not simply copy the script of Bitcoin, but cleverly utilizes three unique features of the Ethereum ecosystem, injecting unprecedented driving force into this flywheel model:
1. Volatility becomes the “catalyst” of financing
In traditional concepts, high volatility often means high risk.But in the issuance of financing tools of the DAT model – especially convertible bonds (CBs), Ethereum’s historical and extended volatility far higher than Bitcoin has become a unique advantage.This high volatility creates a huge appeal for hedge funds that make a living from trading volatility, such as those that do Gamma trading.The result is that ETH Treasury companies can issue convertible bonds under better conditions (higher valuations) to reduce financing costs.Volatility is no longer a pure risk here, but is transformed into a “bait” that attracts specific institutional investors, thus providing cheaper and more abundant fuel for the start of the flywheel.
2. Native income provides an endogenous “stabilizer”
Bitcoin treasury (such as MSTR) pays bond interest or preferred stock dividends, essentially relying on additional stock issuance in the market in exchange for cash, an act that relies heavily on the liquidity of the market and the stability of the stock price.Ethereum’s PoS mechanism gives ETH an endogenous productivity – that is, stable and considerable native returns can be generated through pledge, re-staking, etc.This means that ETH Treasury companies can use this portion of the proceeds to cover the interest costs of their financing instruments, greatly reducing their reliance on the market.
3. mNAV premium forms the “accelerator” of the flywheel
The ratio of market value to net asset value (mNAV) is a key indicator for measuring the valuation of a treasury company and reflects the market’s expectations for its future value-added capabilities.Since ETH’s native income mechanism can continuously increase the amount of ETH per share of the company without relying on additional financing, the market is naturally willing to give ETH treasury companies a higher mNAV premium.The higher the mNAV, the stronger the value-added and acceleration effects of the flywheel.
Ignore the posture of doing mNAV correctly when the price rises and falls of a single coin
If your current strategy is optimistic about mNAV and thinks that Ethereum may have a risk of a pullback, then it is most appropriate to ignore the price rise and fall of a single coin. Taking BMNR as an example, you may think that a long 10,000 BMNR and a short 10,000 ETHA can be achieved simply. But in fact, this is the wrong hedging strategy.
When only long mNAV, we need to consider the intrinsic value per share of BMNR, SBET, ETHA, etc., that is, how many units of ETH actually represent behind each share.This can be seen as the “net worth” of the instrument in ETH.
 Calculation method: ETH content per share = Total ETH holdings / Total number of shares issued
For ETHA, its calculation process is as follows: First, the number of indicative baskets in ETHA is calculated on a certain day: multiply the estimated net asset value (NAV) of the next day by the number of shares in each basket (40,000), and then divide by the CF benchmark index of the day.
According to data from ishares.com, the number of Ethereum for 40,000 shares is 302.56.
302.57/40000=0.00756 ETH
That is, 1 ETHA = 0.00756 ETH
For BMNR, its calculation process is as follows:
Number of shares outstanding: 173,496,950 shares
Number of ETHs held: 1,570,000
i.e. 1 BMNR = 0.00904 ETH
After determining the “ETH content” of the two assets, the next step is to calculate the hedging ratio:
BMNR:ETHA =0.00904:0.00756 = 6:5
According to closing price: 1ETH = 4840
1 The intrinsic value of BMNR is: 0.00904*4840 = 43.75
The closing price of BMNR is 53.49
mNAV of BMNR = 53.49/43.75 = 1.22
According to the same algorithm, calculate the mNAV of SBET: Circular shares: 168,866,724 shares 740,800 ETH to obtain: 1 SBET = 0.00438 ETH
According to closing price: 1ETH = 4840
1 The intrinsic value of SBET is: 0.00438*4840 = 21.19
SBET’s closing price is 20.87
mNAV of SBET = 21.19/20.87 = 1.015
The hedging ratio between SBET and ETHA is: SBET:ETHA =0.00438:0.00756 = 11:19
If the mNAV of SBET is smaller than BMNR, when Ethereum reaches a record high, there is a great possibility of facing a pullback or entering a wide range of fluctuations. According to the operational idea of the title of this section, we are still optimistic that the flywheel of mNAV will continue to run forward, that is, SBET or BMNR will not fall below the intrinsic value before the expiration date, but we do not want to bear the shrinking net value caused by Ethereum’s sharp pullback. Then it should be expected that when the decline of ETH is greater than SBET or BMNR. Choose the smaller mNAV side to go long between SBET and BMNR, and the risk is minimal.
Take 250905 as an example:
We should operate the same SBET selling PUT and ETHA buying PUT: SBET selling 20.5PUT*19 and get a premium of US$2,888
The decline is calculated based on the intrinsic value of SBET: 3.2%
The price of ETHA experienced the same decline was: 35.39
The closest exercise price is 36, so ETHA buys 35PUT*11 and pays a premium of $1,507
The premium income is: $1381
If mNAV rises or remains unchanged, then you will get a premium income. However, once the SBET drops exceed Ethereum, that is, mNAV decreases, then you will lose money. According to the current premium level of SBET, this situation means that the premium enters underwater and the DAT’s flywheel may be pressed.
Therefore, the configuration idea of this strategy should be:It is optimistic that this round of Ethereum market has not ended, that is, mNAV should rise steadily, but it is believed that there will be a pullback in Ethereum in the short term..Therefore, for the purpose of long mNAV, the price changes of single shares and coins are ignored. Of course, this strategy also has its disadvantages, namely, ETH plummets, and the market may expect the “added issuance flywheel to fail”, and the stock price of SBET will often fall more severely than ETH.In this extreme case, Put sellers will suffer a big loss when they have exposure, while ETHA Put does not hedge enough.Or if market sentiment turns negative (expected failure of additional issuance and long ETH pullback cycle), the premium may enter underwater and continue to decline.
When additional issuance of currency stocks leads to a decrease in premium, how should we short mNAV?
For companies like SBET and BMNR, the core of business models is to hold and increase their holdings of ETH, their stock price performance not only depends on the price of ETH, but also is deeply influenced by the company’s own capital operation. The most core of it is the cycle model of financing and purchasing more ETH through the issuance of new shares.In the bull market where ETH prices continue to rise, this model seems to be able to create value, but behind it is the continuous dilution of existing shareholders’ equity.This dilution effect is a mathematical necessity and will ultimately undermine its logic of “eternal growth”.
The core mechanism of equity dilution
To truly understand the operating logic of equity dilution, we can start from a framework of quantitative deduction.The basic starting point is that the additional issuance means that the corresponding assets of the same company must be shared by more shares. Unless the market is unresponsive under ideal conditions (that is, willing to accept additional supply and maintain the valuation unchanged), the relative interests of old shareholders will inevitably be weakened, and the essence of new funds entering is the reallocation of value among shareholders.
Initial settings:
-
Company holdings: Assuming the company’s assets are a portfolio of AI startups worth $200 million, without any debts, so the net assets (NAV) are $200 million.
-
Market value: The market gave it a valuation of $250 million, which reflects a 25% premium.This part of the premium may be due to the market’s enthusiastic pursuit of the AI track or the high expectations for the company’s investment vision.
-
Capital Scale: Set as Q shares.
-
Net Assets Per Share(NAV): 200/Q USD.
-
Price per share: 250/Q USD.
The market is willing to use US$1.25 to purchase every dollar of assets held by the company. This 25% premium is the “fuel” that can be started by subsequent additional issuance cycles.
First additional issuance:
-
Financing scale: The company decided to raise US$100 million by issuing new shares and use all its funds to invest in new AI projects.To maintain market stability, additional issuance must be carried out at the current share price of USD 250/Q.
-
New stocks(M): M=US$100 million ÷(250/Q)=0.4Q stocks.
-
Total new share capital: Qnew=Q+M=Q+0.4Q=1.4Q stock.
-
Total new assets: Anew=200 million US dollars +100 million US dollars =300 million US dollars.
-
New Net Assets per Share: NAVnew=US$300 million ÷(1.4Q)≈$214.29/Q USD.Compared with the original 200/Q, the intrinsic value per share has indeed increased.
-
New market value(Assuming the stock price remains): Market value new=(250/Q)×1.4Q=350 million US dollars.
-
New premium: Premium new=(350 million ÷300 million)−1≈16.67%.
From the book view, the net assets per share increased, the stock price remained unchanged, and the company’s market value also increased significantly.But the essence is that the original 25% premium was diluted to 16.67%.
How value transfer happens:
The newly incorporated US$100 million assets are now jointly owned by all shareholders (new and old).The shareholding ratio of old shareholders has dropped from 100% to Q/1.4Q≈71.43%.
Their interests in the total new assets of $300 million are approximately 300 million×71.43%≈214 million.While that’s $14 million more than the $200 million they originally owned, what they lost is a partial claim for the original high premium.The new shareholder not only bought $100 million in assets for US$100 million, but also “free” to enjoy part of the overall market premium of the company, which is equivalent to entering the market at a discounted price.
If the cycle continues:
Assuming that the company continues to adopt this strategy, each time raising funds equivalent to 40% of the market value at that time:
-
After the first round: assets of 300 million yuan, market value of 350 million yuan, a premium of 16.67%.
-
Round 2: Refinancing 140 million (40% of 350 million), total assets will become 440 million, while the new market value (if the stock price remains unchanged) will reach 490 million, and the premium will be further diluted to about 11.36%.
-
After round 3: The asset scale continues to expand, but the premium will continue to decline.
As the rounds increase, the premium will infinitely approach zero.Ultimately, when the additional issuance price can only be equal to the net assets per share:
-
Net assets per share no longer increase.For example, the asset is K and the equity is P.At this time, the additional issuance can only be made at a price of K/P.If an additional 0.3K of funds is issued, the number of new shares will be 0.3P.The new assets are 1.3K, the new equity is 1.3P, and the net assets per share are (1.3K)/(1.3P)=K/P, exactly the same as before the additional issuance.
-
The “magic” of the additional issuance has failed.Without room for premium, additional issuance no longer has the surface effect of increasing the net assets per share, and new and old shareholders have become a pure zero-sum game.
Why this effect is inevitable:
-
The market will not cooperate forever: investors will conduct valuation analysis. Once they realize that the company’s growth depends only on external blood transfusions rather than endogenous profits, the premium given by the market will shrink rapidly, causing the stock price to fall, thus undermining the premise of “adding issuance at market prices”.
-
Dilution is arithmetic necessity: unless a company can use new funds to create a return rate (g) that is far beyond the market average, and this return rate can continue to outperform the dilution rate of equity capital, dilution is an inevitable mathematical result from the perspective of long-term shareholder value.
Finally, we can see that although the additional issuance process may be overshadowed by halos such as “accelerating asset scale” and “increasing target assets” in the short term, its core is that the rights and interests of old shareholders are gradually transferred to new shareholders, who share the company’s past value and premium at a lower cost.The larger the proportion of financing scale relative to market capitalization, the faster this dilution effect will be.
Strategy for bearish mNAV: BMNR is expected to increase less than ETHA due to additional issuance dilution
What strategy should you formulate based on this? First of all, we are optimistic about the continued bull market, so this is an offensive protection strategy for BMNR’s upcoming issuance.
We believe that its stock price is performing weaker than Ethereum itself and need a strategy that can hedge Ethereum price fluctuations and purely short its mNAV.
Simply shorting BMNR and longing ETHA is a directional bet, but not precise enough.In order to accurately short mNAV, we need to use options and strictly follow its intrinsic value per share (priced in ETH) for hedging.
Step 1: Calculate the intrinsic value per share
We need to reuse the previous calculations to determine the “Network Asset Value” (NAV) of the two assets denominated in ETH.
-
ETH content of ETHA: According to the data of iShares official website, 1 ETHA ≈ 0.00756 ETH
-
ETH content of BMNR: According to the number of ETH held (1,570,000) and the number of outstanding shares (173,496,950), 1 BMNR ≈ 0.00904 ETH
Step 2: Determine the hedging ratio
In order to divest the impact of ETH itself in the transaction, we must calculate the hedging ratio based on their “ETH content”.
Hedging ratio:
BMNR:ETHA=0.00904:0.00756≈1.2:1≈6:5
This means that, from the perspective of intrinsic value, 6 shares of BMNR are approximately equal to the Ethereum value represented by 5 shares of ETHA.
Step 3: Building an option strategy for shorting mNAV
Our goals are:
-
The price of betting on BMNR is weaker than its intrinsic value.
-
Hedge the price fluctuations of ETHA.
Therefore, the correct operation should be:Buy BMNR put options and sell ETHA put options.
-
Buy BMNR PUT: This is the core of our strategy.If the BMNR stock price falls or the increase is less than expected, this position will make a profit.
-
Sell ETHA PUT: This is the source of hedging and capital costs.We sell ETHA’s PUT and charge premiums, expressing our view that we “don’t think ETHA will perform worse than BMNR.”This operation hedges the overall decline risk of the ETH market.If ETH does not fall sharply, this position will make a profit by collecting a premium.
Take the option of 250905 (expired on September 5, 2025) as an example:
Assume the current price: BMNR = $53.49, ETHA = $36.5 (based on $4840/ETH * 0.00756)
We should operate at a ratio of 6:5:
-
Buy BMNR PUT: Choose a strike price close to the average value, for example Buy 6 lots of BMNR $53 PUT.The premium paid is $5.00 per lot and the total expenditure is $5.00 * 100 * 6 = $3,000.
-
Sell ETHA PUT: Also choose a strike price close to the average value, such as Sell 5 lots ETHA $36 PUT.The premium received is $4.20 per lot, and the total income is $4.20 * 100 * 5 = $2,100.
Net Cost: Total Strategy Cost = Financing Payment – Financing Received = $3,000 – $2,100 = $900
This is a net spending strategy, so the biggest loss is the $900 paid.
Profit and loss analysis of strategy
-
Profit scenario (mNAV decline): BMNR gains less than ETHA: ETH rose 10%, and ETHA price rose from 36.5 to 40.15.In theory, BMNR should rise from 53.49 to 58.8.However, due to expectations of dilution of additional issuance, the BMNR only rose to $55.At this time, although your BMNR PUT is a loss, its loss is less than the benefits brought by ETHA PUT (which has become out-of-price waste paper), and the changes in relative value make the entire strategy combination profit.BMNR fell more than ETHA: ETH pulled back by 5%, and ETHA price fell to 34.6.In theory, BMNR should fall to 50.8.But market panic caused mNAV to shrink and BMNR fell to $48.At this time, the value of the BMNR PUT you bought has increased significantly, and its value increases exceeds the losses caused by the ETHA PUT you sold, and the overall strategy is profitable.
-
Loss scenario (mNAV rises or remains unchanged): BMNR rises more than ETHA (mNAV expansion): Market sentiment is fanatical, ETH rises by 10%, but BMNR rises by 20% as a high beta asset.At this time, the BMNR PUT will become a deep price, with a value of zero, and the sold ETHA PUT will also lose all net costs ($900).ETH plunges: If the ETHA price plummets (for example, below $30), the sold ETHA $36 PUT will bring huge losses, which may exceed the gains obtained from the BMNR PUT, resulting in overall strategic losses.
Each strategy has a corresponding idea, and there is no perfect solution. However, when you have a judgment on the current market environment, the corresponding option combination will resist risks or give additional rewards when you make a correct judgment.