Source: Grayscale, compiled by: Baishui, bitchain vision
summary
-
The potential launch of Ethereum spot ETFs will allow more investors to understand the concepts of smart contracts and decentralized applications, thus understanding the potential of blockchain to change digital commerce.
-
Ethereum is the largest asset (by market capitalization) in our smart contract platform cryptocurrency field, and is also the blockchain network with the largest number of users and applications.[1] It is implementing the modular design concept to achieve expansion, where more activity will occur on the relevant Layer 2 network over time.In order to maintain dominance in the highly competitive segment, Ethereum will need to attract more users and increase its expense revenue.
-
According to international precedent, the Grayscale Research team expectsThe demand for spot Ethereum ETFs in the United States will reach about 25%-30% of spot Bitcoin ETFs.A large portion of Ethereum’s supply, such as staking ETH, may not be used for ETFs.
-
Given the high initial valuation,Compared with the launch of Bitcoin ETF in January 2024, there may be more limited room for further price increases.But Grayscale Research remains optimistic about the prospects for both assets.
Last week, the U.S. Securities and Exchange Commission (SEC) approved Form 19b-4 filed by several issuers for spot Ethereum Exchange-traded funds (ETFs), indicating significant progress in listing of these products on U.S. exchanges.Like the spot Bitcoin ETFs that went public in January, these new products could expose a wider range of investors to crypto asset classes.While both assets are based on the same blockchain technology, Ethereum is a standalone network with different use cases (Figure 1).Bitcoin is now used primarily as a digital alternative to store of value and gold, while Ethereum is a decentralized computing platform with a rich application ecosystem that is often analogized to a decentralized application store.New investors interested in exploring such assets may need to consider Ethereum’s unique fundamentals, competitive positioning and its potential role in blockchain-based digital commerce growth.
Chart 1: Ethereum is a smart contract platform
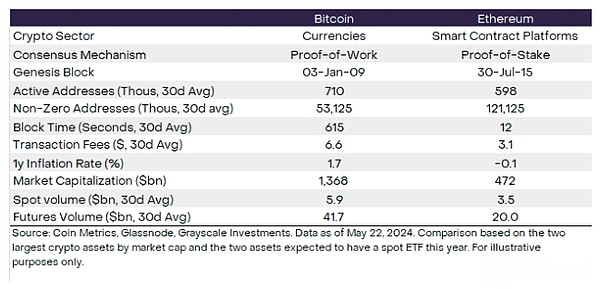
Basics of smart contracts
Ethereum has expanded Bitcoin’s initial vision by adding smart contracts.A smart contract is a pre-programmed and automatically executed computer code.When a user uses a smart contract, it will perform predefined actions without any additional input.A classic metaphor in the real world is a vending machine: the user puts a coin and the vending machine delivers the goods.[2] Using smart contracts, users usually “invest” digital tokens, and the software performs some type of operations.These operations can include anything from exchanging tokens to issuing loans to verifying the user’s digital identity.
Smart contracts run through the Ethereum blockchain mechanism.In addition to recording asset ownership, block-by-block updates of blockchains can also record any arbitrary changes in “state” – a computer science term that indicates the state of data in a database.In this way, by adding smart contracts, the public blockchain can run like a computer (a software computer instead of a hardware computer).With these basic elements, Ethereum and other smart contract platform blockchains can host nearly any type of application and serve as a neutral core infrastructure for the emerging digital economy.
Return on assets and fundamentals
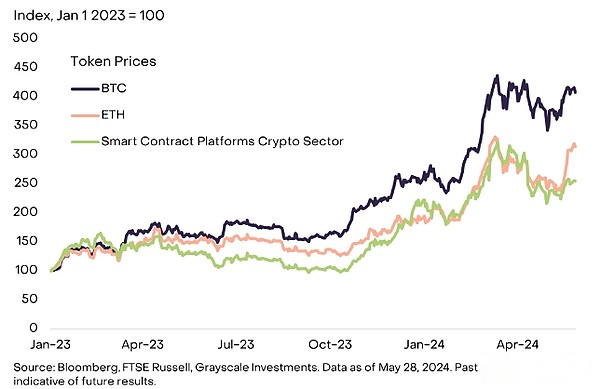
Ethereum (ETH) of the Ethereum network is the largest component of our smart contract platform cryptocurrency space (by market capitalization).[3] From early 2023 to recent, ETH’s performance is basically consistent with this segment (Figure 2).However, it is not as good as Bitcoin (by market capitalization, it is the largest crypto asset in the overall market capitalization) and Solana (by market capitalization, it is the second largest asset in the cryptocurrency field of smart contract platforms).Like Bitcoin, Ethereum has outperformed some traditional asset classes both in absolute value and risk-adjusted since the beginning of 2023.[4]Both Bitcoin and Ethereum achieved risk-adjusted returns comparable to traditional asset classes over a longer period of time, although volatility is significantly higher.
Figure 2: Until recently, ETH’s performance has been consistent with the cryptocurrency sector
With Ethereum’s modular design, different types of blockchain infrastructure are designed to work together to provide an end-user experience.in particular,More activity is expected to occur on Ethereum’s Layer 2 network over time(Add to provide blockchain functionality and connect to the Layer 1 Ethereum main network additional software), toAllows ecosystem to expand.Layer 2 checks regularly and publishes its transaction history to Layer 1, benefiting from its cybersecurity and decentralization.This approach contrasts sharply with blockchains with monolithic design philosophy, such as Solana, where all key operations (execution, settlement, consensus, and data availability) are performed in a single Layer 1 network.
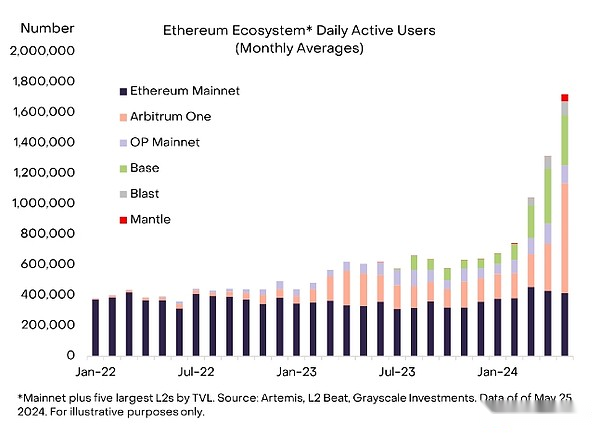
In March 2024, Ethereum underwent a major upgrade and is expected to facilitate its transition to a modular network architecture (see our report on detailsEthereum’s maturity: “Dencun” and ETH 2.0”).Judging from the blockchain activity, this upgrade was successful: the number of active addresses on the Layer 2 network has increased significantly, currently accounting for about two-thirds of the total activity of the Ethereum ecosystem (Figure 3).
Figure 3: Ethereum Layer 2 activity increases significantly
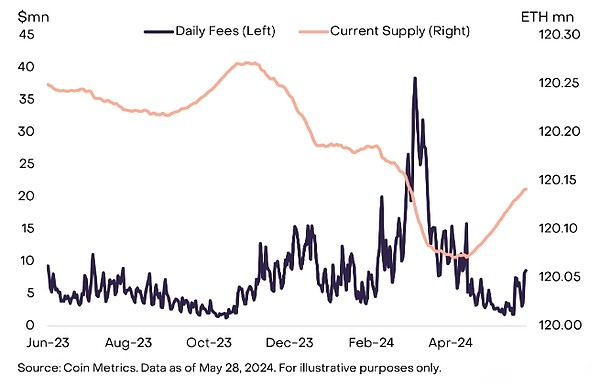
Meanwhile, the transfer of activity to the Layer 2 network has also affected Ether’s token economics, at least in the short term.Smart contract platform blockchain accumulates value mainly through transaction fees, which are usually paid to validators or used to reduce the supply of tokens.In the Ethereum ecosystem, the basic transaction fee is burned (destroyed and removed from circulation), while the priority fee (“tip”) is paid to the validator.When Ethereum’s transaction revenue is relatively high, the number of tokens destroyed usually exceeds the speed of new issuances, and the total supply of ETH tends to decline.However, as network activity shifts to Layer 2, expense revenue on the Ethereum mainnet has declined, and ETH supply has begun to increase again (Figure 4).The Layer 2 network also pays fees to publish its data to Layer 1 (so-called “blob fees”, as well as other transaction fees), but the amount is often relatively low.
Figure 4: ETH supply has increased recently due to low mainnet costs
In order for Ethereum’s value to increase over time, the Ethereum mainnet will likely need to see an increase in fee income.[5]This may be achieved in two ways: i) a moderate increase in Layer 1 activity, paying higher transaction costs, or ii) a significant increase in Layer 2 activity, paying lower transaction costs.Grayscale Research expects this will be a combination of Layer 1 and Layer 2 activities and expense revenue increase.
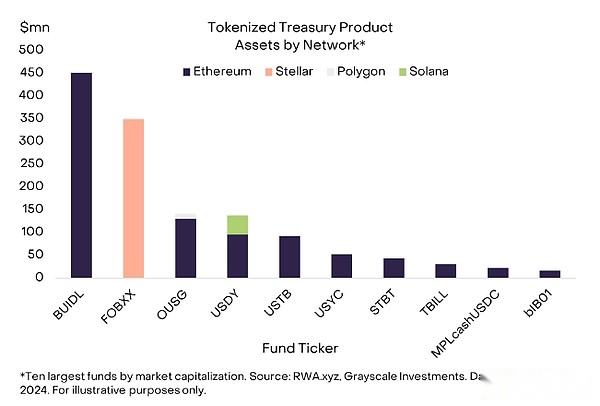
We believe thatThe growth of Layer 1 activity is most likely to come from low-frequency and high-value transactions, and anything that requires a high degree of decentralization(At least until the Layer 2 network is decentralized enough).This may include many types of tokenization projects, where transaction costs may be relatively low compared to the dollar value of the transaction.Currently, approximately 70% of tokenized U.S. Treasuries are on the Ethereum blockchain (Figure 5).We believe thatNon-fungible tokens (NFTs) with relatively high value may also remain on the Ethereum mainnet because they benefit from the high security and decentralization of Ethereum and have relatively low frequency of change hands (for similar reasons,We expect Bitcoin NFT to continue to grow).
Figure 5: Ethereum hosts most tokenized Treasury bonds
In contrast, relatively high frequency and/or low value transactions occur more naturally on various Layer 2 networks in Ethereum.A good example is the social media app, and we have seen various recent success stories hosted on Ethereum Layer 2, including friend.tech (Base), Farcaster (OP Mainnet) and Fantasy Top (Blast).We believe thatGames and retail payments may also require very low transaction costs and are more likely to migrate to the Layer 2 network.It is important, however, that given the low transaction costs, these applications need to attract a large number of users in order to significantly increase the expense revenue of the Ethereum mainnet.
Potential Impact of Spot Ethereum ETFs in the United States
In the long run, Ethereum’s market cap should reflect its expense income and other fundamentals.But in the short term, the market price of tokens may be affected by changes in supply and demand.While we have seen progress in the US spot Ethereum ETF’s full regulatory approval, issuers still require their registration statement to be reviewed and declared effective by the Securities and Exchange Commission’s Corporate Finance Department.As assets are available to a wider range of investors, full approval of these products and transaction launches may bring new demand.Given simple supply and demand dynamics, Grayscale Research expects the number of people accessing Ethereum and Ethereum protocols through ETF wrappers to help drive demand and thus increase the price of tokens.
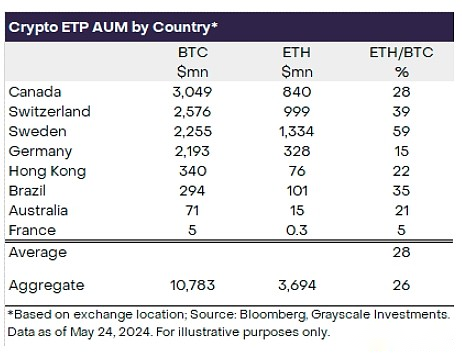
Outside the United States, both Bitcoin and Ethereum Exchange Trading Products (ETPs) have been listed, with assets in Ethereum ETP accounting for approximately 25%-30% of Bitcoin ETP assets (Figure 6).On this basis, Grayscale Research’s assumption is thatNet inflows of spot Ethereum ETFs listed in the United States will reach 25%-30% of the net inflows of spot Bitcoin ETFs so far, or $3.5-4 billion in the first four months or so (accounting for spot Bitcoin ETFs since January25%-30% of the net inflow of US$13.7 billion).[6] Ethereum has a market capitalization of about one-third (33%) of Bitcoin’s market capitalization, so our assumptions mean that Ethereum’s net inflows may be slightly smaller in proportion to market capitalization.While we believe this is a reasonable assumption, the estimates are uncertain, and there is a high and low risk of net inflows of spot Ethereum ETFs listed in the United States.In the US market, ETH futures ETFs only account for about 5% of BTC futures ETF assets, although we believe this does not represent the relative demand for ETH ETFs.[7]
Figure 6: Outside the United States, Ethereum ETP asset management scale accounts for 25%-30% of Bitcoin ETP asset management scale
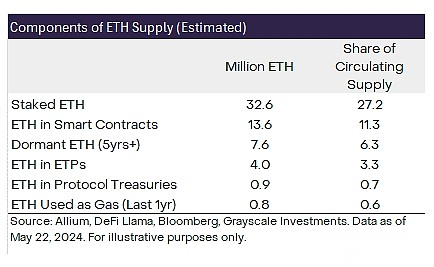
In terms of ETH supply, Grayscale Research believes thatAbout 17% of ETH can be classified as idle or relatively lack of liquidity.According to data analytics platform Allium, this includes about 6% of the ETH supply not moving for more than five years, and about 11% of the ETH supply “locked” in various smart contracts (such as bridges, encapsulated ETH and variousother applications).In addition, 27% of ETH supply is pledged.Recently, spot Ethereum ETF application issuers, including Grayscale, have removed the stake from public files, indicatingThe SEC may allow these products to be traded in the United States without pledge.Therefore, this portion of the supply is unlikely to be purchased by ETFs.
In addition to these categories, gas ETH used for online transactions is $2.8 billion per year.This represents an additional 0.6% supply at current ETH price.[8] There are also many agreements that hold a large amount of ETH in their treasury, including the Ethereum Foundation ($1.2 billion worth of ETH), Mantle (approximately $879 million ETH), and Golem ($995 million ETH).Overall, ETH in the agreement treasury accounts for approximately 0.7% of the supply.[9] Finally, approximately 4 million ETH, or 3% of the total supply, is already held in the ETH ETP.[10]
Overall, these groups account for nearly 50% of the ETH supply despite partial overlap in categories (e.g., ETH in the protocol treasury may be pledged) (Figure 7).For any potential new U.S. listed spot Ethereum ETF, we believe that net purchases of ETH are more likely to come from the remaining circulating supply.If existing uses limit the available supply of new spot ETF products, any incremental increase in demand may have a greater impact on price.
Figure 7: A large portion of ETH supply cannot enter new spot ETFs
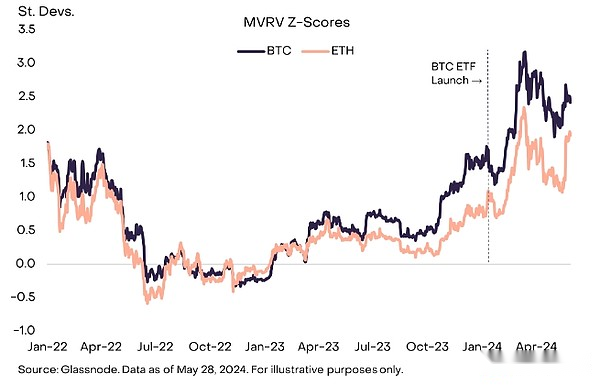
From a valuation perspective,Ethereum’s valuation can be said to be higher than Bitcoin when the spot Bitcoin ETF was launched in January.For example, a popular valuation metric is the MVRV z score.This indicator is based on the ratio of the token’s total market value to its “realized value”: based on the market value of the token’s last time moved on the chain (rather than the price traded on the exchange).When the spot Bitcoin ETF was launched in January, its MVRV z score was relatively low, indicating moderate valuations and that there might be more room for price increases.The cryptocurrency market has been appreciating since then, with both Bitcoin and Ethereum’s MVRV ratios increasing (Figure 8).This may indicate thatCompared with the approved US spot Bitcoin ETF in January, the spot ETH ETF has less room for price increase after approval.
Figure 8: ETH is more valuable than BTC when spot Bitcoin ETF is launched
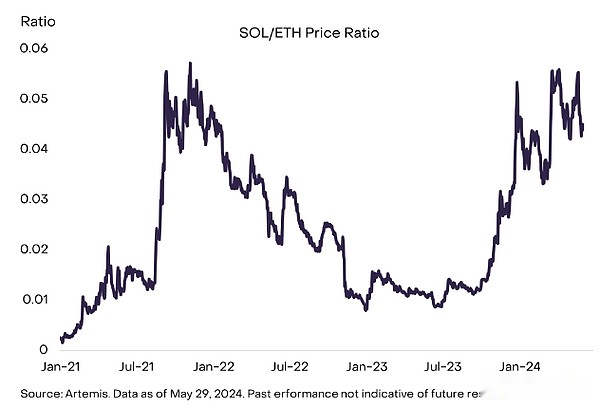
at last,Cryptocurrency native investors may be concerned about the impact of spot Ethereum ETFs on competition in the cryptocurrency sector of smart contract platforms, especially the SOL/ETH price ratio.Solana is the second largest asset in the segment (by market capitalization), Grayscale Research believes thatIn the long run, it is currently most likely to capture market share from market leader Ethereum.Solana has performed significantly better than Ethereum in the past year, and the SOL/ETH price ratio is now close to the peak of the previous cryptocurrency bull market(Figure 9).[11] Part of the reason may be that despite the failed cryptocurrency exchange FTX, in terms of token ownership and development activities, the network’s user and developer community continues to develop the ecosystem.More importantly, Solana is also able to drive increased transaction activity and fee revenue through a compelling user experience.In the short term, we expect the SOL/ETH price ratio to flatten, as inflows from new spot Ethereum ETFs will support the price of ETH.However, in the long run, the SOL/ETH price ratio is likely to be determined by the relative increase in fee income between the two chains.
Figure 9: SOL/ETH price ratio approaches the previous cycle high
Looking to the future
Although the launch of ETH ETFs in the U.S. market may have a direct impact on valuations, the important impact of regulatory approval goes far beyond price.Ethereum provides another framework for digital commerce based on decentralized networks.Blockchain may offer more possibilities, including near-instant cross-border payments, true digital ownership, and interoperable applications.While there are other smart contract platforms that offer this practical functionality right now, the Ethereum ecosystem has the largest number of users, the most decentralized applications and the deepest pool of funds.[12] Grayscale Research predicts thatNew spot ETFs can introduce this transformative technology to a wider range of investors and other observers and help accelerate blockchain adoption.
References:
[1] Source: Artemis, Dapp Radar.Data as of May 27, 2024.
[2] This metaphor comes from computer scientist Nick Szabo’s 1997 memo “The Idea of Smart Contracts.”
[3] Source: Artemis.Data as of May 27, 2024.
[4] For example, from December 31, 2022 to May 23, 2024, the price return and return of Bitcoin and Ethereum divided by annualized volatility exceeded the global stock market (by MSCI All Countries World Index), global bond market (represented by Bloomberg-Barclays Global Comprehensive Index) and commodity market (represented by S&P/GSCI).Source: Bloomberg, Grayscale Investments.Data as of May 23, 2024.
[5] While Grayscale Research believes that fee income is the main driver of smart contract platform valuation, other factors may include maximum withdrawable value (MEV), possibly a “monetary premium” (willing to hold assets to store value and/oras a medium of exchange) and other factors.
[6] Source: Bloomberg, Grayscale Investments.Data as of May 24, 2024.
[7] Source: Bloomberg, Grayscale Investments.Data as of May 28, 2024.
[8] Source: Artemis, Grayscale Investments.Data as of May 24, 2024.
[9] Source: DeFi Llama.
[10] Source: Bloomberg, Grayscale Investments.Data as of May 24, 2024.
[11] From the perspective of market value, Solana’s supply growth is even greater because of its relatively high growth.
[12] Source: Artemis, Dapp Radar, Defi Llama.Data as of May 27, 2024.