
Source: Grayscale; Compilation: Tao Zhu, Bitchain Vision
summary
-
Historically, cryptocurrency valuations followed a distinct four-year cycle, with prices experiencing consecutive periods of appreciation and depreciation.Grayscale Research believes investors can monitor a variety of blockchain-based metrics and other measures to track cryptocurrency cycles and inform their risk management decisions.
-
Cryptocurrencies are a mature asset class: new spot bitcoin and Ethereum exchange-traded products (ETPs) have expanded market access, and the incoming U.S. Congress may bring greater regulatory clarity to the industry.For all these reasons, cryptocurrency valuations may eventually surpass the four-year cycle that emerged in the early history of the market.
-
That being said, Grayscale Research believes that the current combination of indicators is consistent with the intermediate stages of the cycle.As long as the asset class remains supported by fundamentals such as application adoption and broader macro market conditions, the bull market is likely to continue into 2025 and beyond.
Like many physical goods, the price of Bitcoin does not follow a strict “random walk”.[1] Instead, prices show evidence of statistical momentum: price increases tend to follow the upward trend, and price declines tend to follow the downward trend.Over a longer time frame, the repeated occurrence of Bitcoin appreciation and depreciation has led to the price cycle surrounding a historical upward trend (Figure 1).
Figure 1: The upward trend of Bitcoin’s price is a cycle of repeated fluctuations
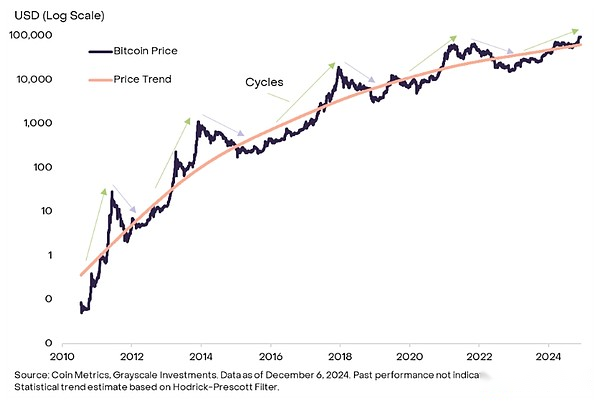
Every past price cycle has its own unique drivers, and there is no reason for future price returns to be fully reflected in past experience.Furthermore, as Bitcoin matures and is adopted by a wider range of traditional investors, and as the impact of the four-year halving event on supply declines, cyclical changes in Bitcoin prices may be reshaped or disappear entirely.Nevertheless, studying past cycles may provide investors with some guidance on typical statistical behaviors of Bitcoin and therefore can provide reference for risk management decisions.
Measure momentum
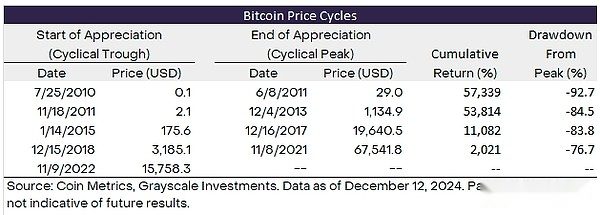
Figure 2 shows the price performance of Bitcoin during each previous cycle appreciation stage.Prices are compiled into the 100 index at the low point of the cycle (marking the beginning of the cyclical appreciation phase) and are tracked until their peak (marking the end of the appreciation phase).Figure 3 shows the same information in a tabular form.
The first price cycle in Bitcoin history is relatively short and steep: the first cycle lasts for less than a year and the second cycle lasts about two years.In both cases, the price has risen more than 500 times higher than the previous cycle low.The following two cycles lasted less than three years respectively.Bitcoin’s price rose by more than 100 times in the January 2015-December 2017 cycle, while Bitcoin’s price rose by about 20 times in the December 2018-November 2021 cycle.
Figure 2: Bitcoin trend is relatively close to the past two market cycles
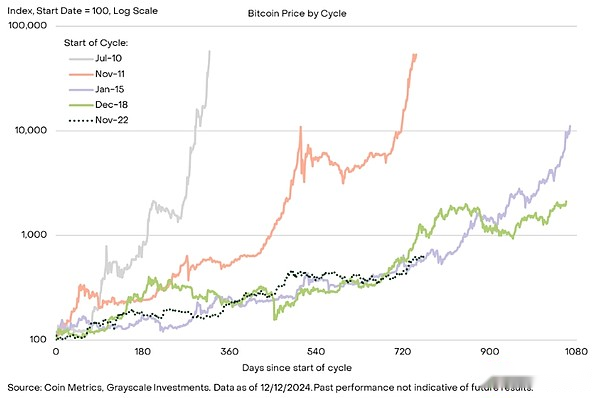
After peaking in November 2021, Bitcoin’s price fell to a cyclical low of about $16,000 in November 2022.The current price increase period began since then and therefore lasted for more than two years.As shown in Figure 2,The latest price increase is relatively close to the past two Bitcoin cycles, which lasted about a year before the price peaked.From amplitude perspective, Bitcoin’s approximately 6x return this cycle, while meaningful, is much lower than the return achieved in the past four cycles.all in all,While we are not sure whether future price returns will be similar to past cycles, Bitcoin’s history tells us that the latest bull market can continue in terms of duration and amplitude.
Figure 3: Four different cycles in Bitcoin price history
Measure bull market status through various indicators
In addition to measuring price performance in past cycles, investors can also use various blockchain-based indicators to measure the maturity of the Bitcoin bull market.For example, common metrics measure how much Bitcoin appreciates relative to the buyer’s cost base, how much new Bitcoin funds inflows, and how much price is relative to Bitcoin miner income.
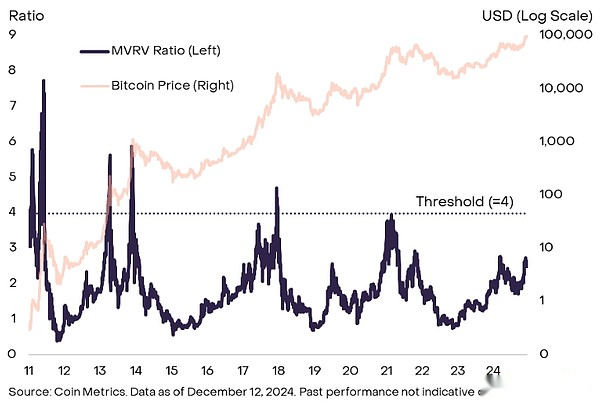
A particularly popular indicator to calculate Bitcoin’s market value (MV) (each token is measured by its secondary market price) and its realization value (RV) (each token is measured by its last on-chain price)ratio.This indicator, known as the MVRV ratio, can be considered as the extent to which Bitcoin market capitalization exceeds the total cost basis of the market.The MVRV ratio has reached a value of at least 4 over the last four cycles (Figure 4).The current MVRV ratio is 2.6, indicating that the latest cycle may continue.However, the MVRV ratio peaks at a lower level in each cycle, so the indicator may never reach a level 4 until the price reaches its peak.
Figure 4: Intermediate MVRV ratio
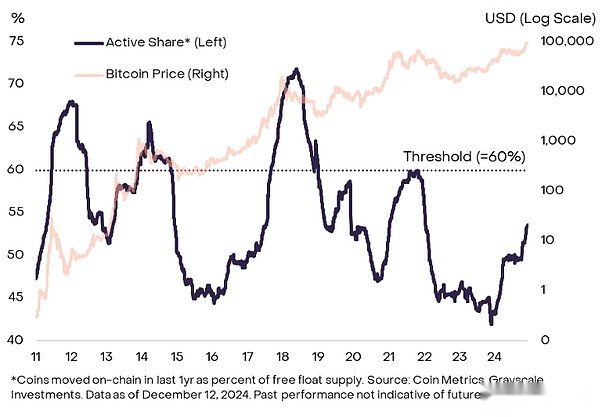
Other on-chain metrics measure the extent to which new funds enter the Bitcoin ecosystem—a framework that experienced cryptocurrency investors often refer to as HODL Waves.Prices may appreciate as new capital buys Bitcoin from long-term holders at slightly higher prices.There are a variety of specific measures to choose from, but Grayscale Research is more inclined to use the number of tokens transferred on-chain last year, relative to the total free circulation supply of Bitcoin (Figure 5).[2] This indicator has reached at least 60% over the last four cycles—which means that at least 60% of the free circulation supply is traded on-chain in one year during the appreciation phase.Currently this figure is about 54%, which suggests that we may see more tokens changing hands on the chain before the price reaches its peak.
Figure 5: Less than 60% of Bitcoin’s active circulation last year
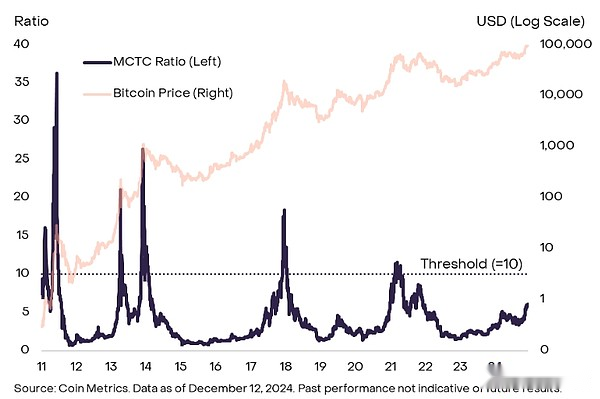
Other cyclical indicators focus on Bitcoin miners, professional service providers that protect the Bitcoin network.For example, a common measure is to calculate the miner cap (MC) (the dollar value of all Bitcoins held by miners) and the so-called “hot cap” (TC) (bits issued to miners through block rewards and transaction fees)ratio of the cumulative value of the currency.The intuition is that when the value of miners’ assets reaches a certain threshold, they may start to make profits.Historically, when the MCTC ratio exceeds 10, the price then peaks during the period (Figure 6).Currently, the MCTC ratio is about 6, indicating that we are still at the middle point of the current cycle.However, similar to the MVRV ratio, the metric peaks at lower levels in each cycle, and the price may peak before the MCTC ratio reaches 10.
Figure 6: Bitcoin miner metrics are also below previous thresholds
There are many other on-chain metrics that may differ subtly from those of other data sources.Furthermore, these tools can only have a rough understanding of the current price increase phase compared to the past and cannot guarantee that the relationship between these indicators and future price returns will be similar to that of the past.That being said, but overall,Common indicators of the Bitcoin cycle are still below the level when prices peaked in the past, which suggests that the current bull market may continue if supported by fundamentals.
Beyond Bitcoin
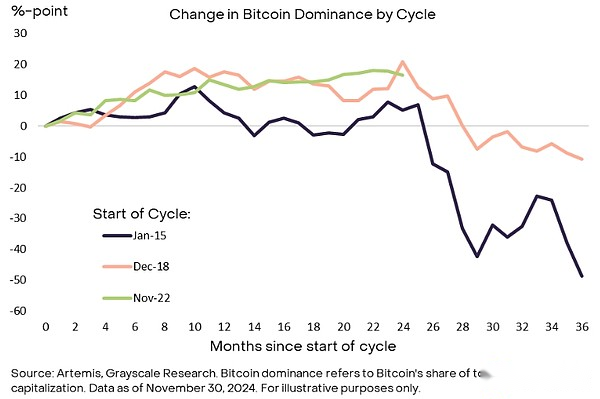
The cryptocurrency market is more extensive than Bitcoin, and signals from other sectors of the industry may also provide guidance on the market cycle status.We believe that these indicators may be particularly important in the coming year due to the relative performance of Bitcoin and other crypto assets.Bitcoin’s dominance (bitcoin’s share of the total market capitalization of cryptocurrencies) peaked around two years after the start of the bull market (Figure 7).[3] Bitcoin’s dominance has recently begun to decline, which has once again occurred about two years of the market cycle.If this continues, investors should consider focusing on a broader measure to determine whether cryptocurrency valuations are approaching cyclical highs.
Figure 7: Bitcoin’s dominance declines in the third year of the past two cycles
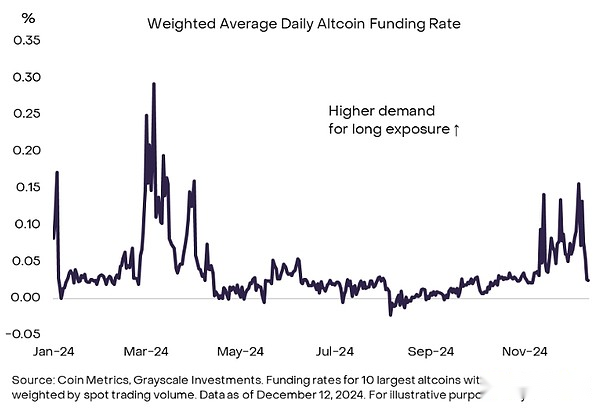
For example, investors can monitor financing rates, i.e. operating costs of holding long positions in perpetual futures contracts.Financing rates tend to rise when speculative traders have high demand for leverage.Therefore, the financing rate level of the entire market can indicate the overall position of speculative traders.Chart 8 shows the weighted average financing rates for the 10 largest crypto assets (i.e. the largest “altcoins”) after Bitcoin.[4]Currently, financing rates are positive, indicating demand for long positions by leveraged investors, although financing rates have dropped sharply over the past week’s decline.In addition, even at local highs, financing rates remain below levels earlier this year and the highs of the previous cycle.therefore,We believe that the current level is consistent with the medium-level speculative position in the market, and not necessarily with the mature market cycle.
Figure 8: Funding rates indicate that the speculative length of the altcoin is at a moderate level
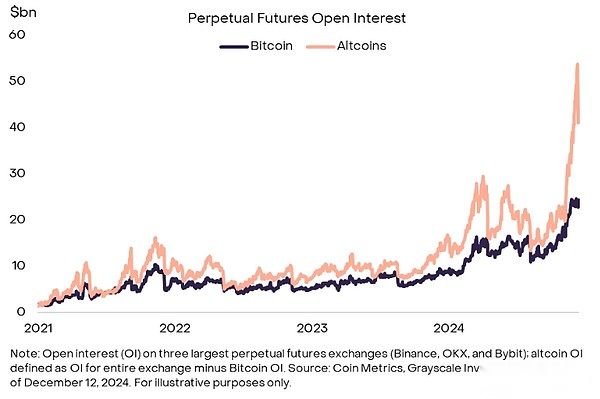
By contrast, the perpetual futures open contract (OI) of altcoins have reached relatively high levels.Prior to the major liquidation incident on Monday, December 9, the three major perpetual futures exchanges had reached nearly $54 billion in altcoin open contracts (Figure 9).This shows that the overall market speculative trader position is relatively high.Altcoin opens fell by about $10 billion after a massive liquidation earlier this week, but remained at a high level.Speculative traders have a higher long position that may be consistent with the later stages of the market cycle, so it may be important to continue monitoring this indicator.
Figure 9: The level of open contracts for altcoins before recent liquidation is high
Summarize
The digital asset market has made great progress since the birth of Bitcoin in 2009, and many characteristics of the current crypto bull market are different from those in the past.On top of that, the U.S. market approval of spot Bitcoin and Ethereum ETP has brought in $36.7 billion in net capital inflows and helped incorporate these assets into a more traditional portfolio.[5] In addition, we believe thatThe recent U.S. election could bring more regulatory clarity to the market and help ensure the permanent status of digital assets in the world’s largest economy — a major change compared to the past, when observers repeatedlyQuestioning the long-term future of the crypto asset class.For these reasons, valuations of Bitcoin and other crypto assets may not follow the four-year cycle that this asset class has in its early history.
at the same time,Bitcoin and many other crypto assets can be considered digital goods and, like other commodities, may show a certain level of price momentum.Therefore, the evaluation of on-chain indicators and altcoin positioning data can provide reference for investors to make risk management decisions.Grayscale Research believes thatThe current combination of indicators is consistent with the mid-term phase of the crypto market cycle: indicators such as MVRV ratios are well above their cyclical lows, but have not yet reached the level marking the previous market top.As long as we are supported by fundamentals such as application adoption and broader macro market conditions, we believe there is no reason why the crypto bull market cannot last until 2025 and beyond.
Comments
[1] In the context of financial markets, random walk refers to the evolution of asset prices in an unpredictable way.
[2] Coin Metrics defines the free floating Bitcoin supply as tokens that have been active at least once in the past five years.
[3] Figure 7 shows only the last two cycles, as the altcoin market has not yet developed sufficiently before this.
[4] Defined as the token with the largest market capitalization after Bitcoin with available data.There is no data for TON, so the next largest asset, DOT.
[5] Source: Bloomberg, Grayscale Investments.Data as of December 11, 2024.