Author: Zach Pandl, Michael Zhao, Grayscale Rresearch; Compilation: 0xjs@Bitchain Vision
Key points:
● From a historical perspective, cryptocurrencies have shown a clear four-year cycle, experiencing continuous price fluctuations.Grayscale Research believes that investors can monitor a variety of blockchain-based indicators and other measurement standards to track encryption cycles and provide a basis for risk management decisions.
● Cryptocurrencies are developing into mature asset classes: new bitcoin and ether spot ETPs expand market access, and the incoming U.S. Congress may bring clearer regulation to the industry.Given the above factors, cryptocurrencies may eventually break through the four-year cycle with significant early market characteristics.
● Nevertheless, grayscale research determines the mid-term stage of the current indicator combination fits the cycle.As long as the fundamentals are stable, if the application is popular and the macro market environment is improving, the bull market is expected to continue until 2025 and beyond.
Similar to many physical goods, Bitcoin prices do not follow the strict “random walk” model.In fact, there are signs of statistical momentum in its price: it is easy to continue to rise when it rises, and it often falls continuously when it falls.Looking at a longer span, Bitcoin’s cycle of growth and growth fluctuates around the historical uptrend line (Figure 1).
Figure 1: The cyclical fluctuation characteristics of Bitcoin price surrounding an upward trend
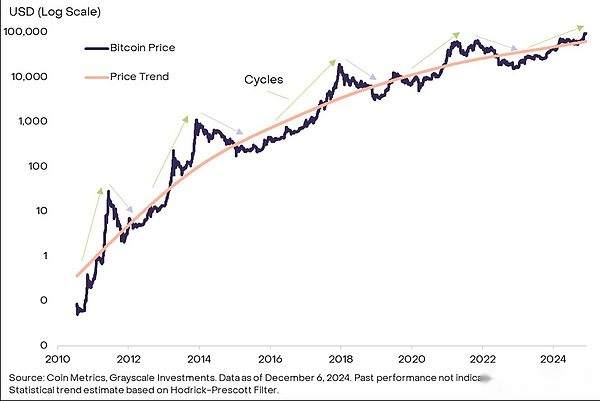
The drivers of past price cycles vary, and future price returns may not necessarily replicate past experience.With Bitcoin maturity, acceptance by more traditional investors, and the decline in the supply impact of the four-year halving event, its price cycle may be reshaped or even disappear.However, studying past cycles can help investors understand the typical statistical characteristics of Bitcoin and help risk management.
Measuring momentum
Figure 2 shows the price performance of Bitcoin during the previous few cycles.The price is set to 100 as the benchmark (marking the start of the cycle appreciation phase) and tracks to the peak (marking the end of the appreciation phase).Figure 3 presents the same information in tabular form.
Bitcoin’s early cycle was short and its rise was rapid: the first cycle was less than a year, and the second cycle was about two years.Both soared more than 500 times from previous cycle lows.The last two cycles are nearly three years each.In the January 2015 to December 2017 cycle, Bitcoin increased by more than 100 times; in the December 2018 to November 2021 cycle, the increase was about 20 times.
Figure 2: The Bitcoin trend in this cycle is very similar to the trajectory of the first two market cycles
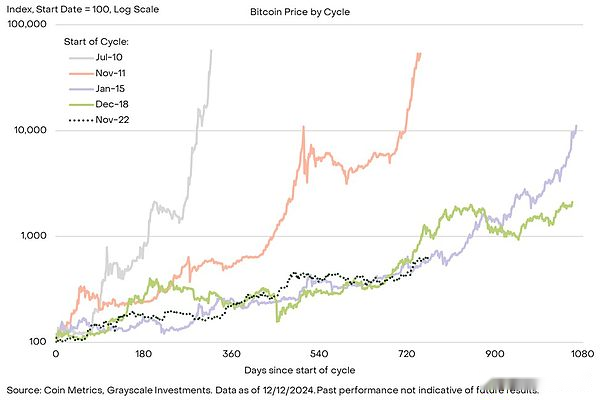
After reaching the peak in November 2021, the Bitcoin price fell to a cycle low of about $16,000 in November 2022, and the current cycle has started, which has been more than two years.As shown in Figure 2, this round of price rise is similar to the previous two rounds of Bitcoin cycle, and the first two rounds will need to reach the price peak in one year.In terms of range, this cycle has increased by about 6 times, which is also considerable, but it is far inferior to the past four rounds.In short, although it is impossible to be sure that future price trends fit in the past cycle, history shows that this bull market has room for expansion in both duration and amplitude.
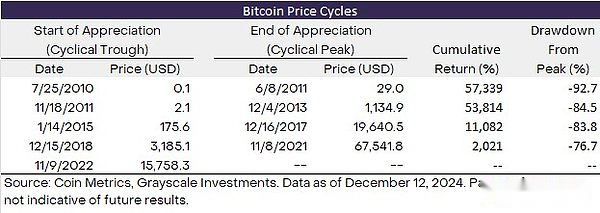
Figure 3: Four unique cycles in Bitcoin price history
Check key indicators
In addition to analyzing past cycle price trends, investors can use a variety of blockchain indicators to measure the progress of the Bitcoin bull market.Common indicators cover the appreciation of Bitcoin buyer costs, the scale of new capital inflows, the relative level of price and Bitcoin miner returns, etc.
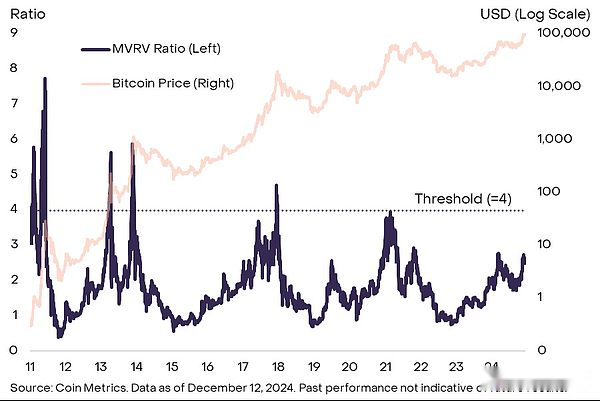
Among them, the most popular indicator is the ratio of Bitcoin market value (MV, each coin based on the secondary market price) to the realization value (RV, each coin based on the recent transaction price on the chain), that is, the MVRV ratio, which can be regarded asThe market value of Bitcoin exceeds the total market cost.This ratio has reached at least 4 in the past four cycles (Figure 4).The current MVRV ratio is 2.6, indicating that there may be subsequent market conditions in this cycle.However, the peak of this ratio in each cycle gradually decreases, and the price may not reach 4 before reaching the top.Figure 4: The MVRV ratio is at the intermediate level
Other on-chain indicators consider the degree of the injected Bitcoin ecosystem by new funds, which are often called “HODL Waves”.Prices may increase as new capital purchases coins from long-term holders.There are many indicators, and grayscale research tends to select the ratio of the amount of on-chain transferred coins to the total circulation supply of Bitcoin in the past year (Figure 5).In the past four cycles, this indicator has reached at least 60%, which means that at least 60% of the circulation and supply have changed hands in one year during the appreciation stage.Currently it is about 54%, implying that the price has reached the top and we may see a further increase in turnover rate on the front chain.
Figure 5: Bitcoin circulation activity is less than 60% in the past year

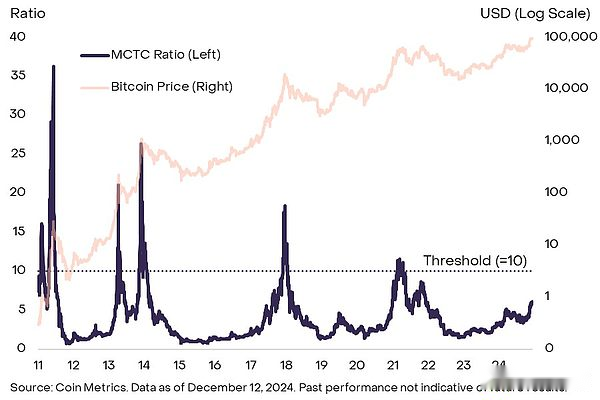
There are also cycle indicators that focus on Bitcoin miners, that is, professional service providers who maintain the Bitcoin network.For example, the ratio of the commonly used miner’s market value (MC, the value of miner’s coin holding USD) to the “heat cap” (TC, the accumulated value of Bitcoin earned by miners through block rewards and transaction fees).The principle is that miners’ assets may make profits when they reach a specific threshold.Historical data shows that after the MCTC ratio exceeds 10, prices tend to peak in the cycle (Figure 6).Currently it is about 6, indicating that it is in the middle phase of the cycle.But similar to the MVRV ratio, this indicator has a peak in each cycle, and the price may reach 10 before it hits the top.
Figure 6: The indicators based on Bitcoin miners are also below the previous threshold
There are many indicators on the chain, and different data sources may vary.Moreover, these tools only roughly judge the similarities and differences between the current price appreciation stage and the past, and cannot ensure that the relationship between indicators and future price returns is constant.Overall, common indicators of Bitcoin cycle are still lower than the previous peak price level. If fundamental support is stable, the current bull market may continue.
Other cryptocurrencies in addition to Bitcoin
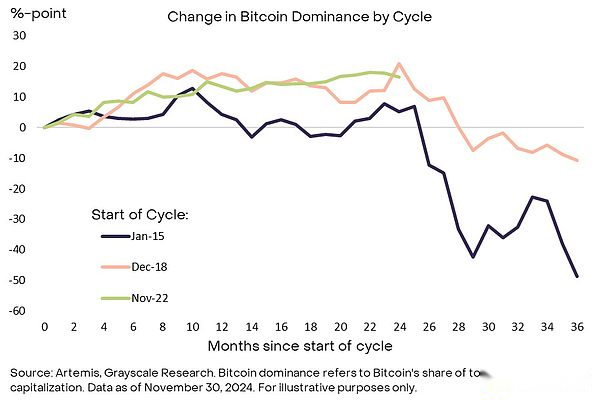
The crypto market far exceeds the scope of Bitcoin, and signals in other areas of the industry can also guide the market cycle trend.Such indicators will be particularly critical in the coming year given Bitcoin’s relative performance with other crypto assets.In the past two rounds of market cycles, Bitcoin’s dominance (accounting for the total market value of the crypto market) topped the top in about two years of the bull market (Figure 7).Its dominant decline recently coincides with the two-year node of this round of market cycle.If this trend continues, investors should combine more indicators to determine whether the crypto valuation is approaching the high point of the cycle.
Figure 7: Bitcoin dominance begins in the third year of the first two cycles
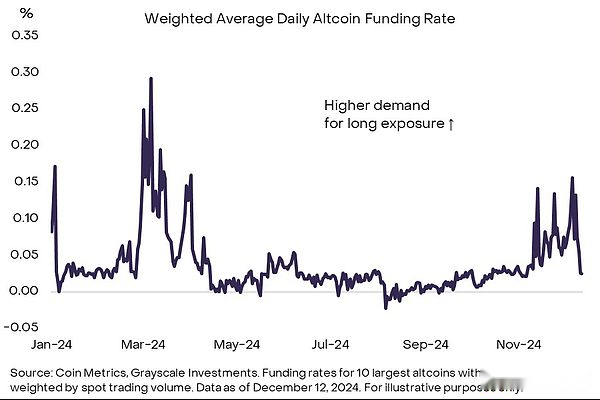
For example, investors can monitor the capital rate, i.e., the long holding cost of perpetual futures contracts.When speculative traders have high leverage demand, the capital rate rises.Therefore, the market capital rate level can measure the overall speculative longness.Figure 8 shows the weighted average funding rates of the top ten crypto assets outside Bitcoin (the largest “altcoins”).Current rates are significantly positive, indicating strong demand for long investors in leveraged investors, despite a sharp drop in the market last week.Even the local highs are lower than the peak at the beginning of this year and the previous round.From this point of view, the current level is in line with the market’s moderate speculative bulls and is still far from the peak of the market cycle.
Figure 8: Altcoin capital rates show moderate speculative longs
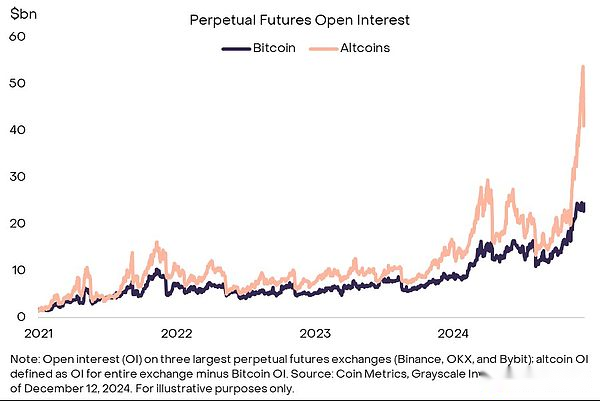
In contrast, the open contract volume (OI) of altcoin perpetual futures rose to a high.Before the massive liquidation on Monday, December 9, the three major perpetual futures exchange altcoin OIs were nearly US$54 billion (Figure 9), highlighting the high market speculative long positions.After a massive liquidation early this week, OI dropped by about $10 billion but remained at a high level.Highly speculative long positions are in line with the characteristics of the late stage of the market cycle, so they need to be continuously monitored.
Figure 9: The open-closed altcoin contract volume is at a high level before recent liquidation
Then play music
Since the birth of Bitcoin in 2009, the digital asset market has developed rapidly, and this round of crypto bull market is different from the past in many aspects.The key is that the US market Bitcoin and Ethereum spot ETP have been approved to introduce a net inflow of $36.7 billion, driving its integration into traditional investment portfolios.Moreover, the recent US elections are expected to enhance market supervision transparency and stabilize digital assets as the world’s largest economy. This change is of far-reaching significance, and the long-term prospects of crypto assets in the past have been repeatedly questioned.Therefore, the valuation of Bitcoin and other crypto assets may not repeat the mistakes of the early four-year cycle.
At the same time, crypto assets such as Bitcoin have the same price and momentum characteristics.Therefore, analyzing on-chain indicators and altcoin holding data can contribute to investor risk management decisions.
Grayscale research determines that the current indicator combination fits the mid-term cycle of the crypto market: the MVRV ratio is higher than the cycle low point, and is still far from the previous market top.As long as the fundamentals are stable, such as popular applications and the macro environment is improving, there is no reason why the crypto bull market will not continue until 2025 and beyond.