
Author: UkuriaOC, CryptoVizArt, Glassnode; Compiled by: Deng Tong, Bitchain Vision
summary
-
Most Bitcoin investors hold unrealized profits, and speculative interest returns to the market for the first time after two months of sideways trading.
-
The short-term group of holders bears the vast majority of market losses, which usually occurs when bull markets adjust from new highs.
-
Both long-term and short-term holders’ sell-side risk ratios have undergone resets, indicating a new balance has been found.The market is ready to move and the expectation of recent volatility should strengthen.
Mt Gox’s progress
On May 28, 2024, the market responded to the internal wallet integration of the Mt.Gox trustee (the legal entity responsible for custodying the 141,000 BTC on the bankrupt exchange).More than a decade later, this is the first time that the long-awaited Mt.Gox distribution event is coming.
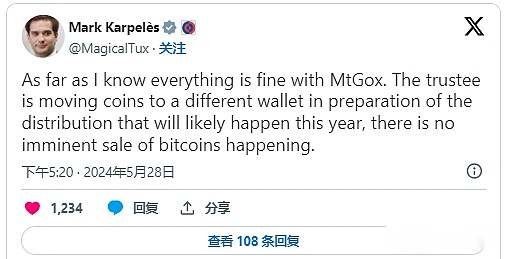
Mark Karpeles, former CEO of Mt.Gox, confirmed that the nature of token flows is due to internal wallet management preparing for allocation to creditors.The allocation is expected to be completed in October this year.
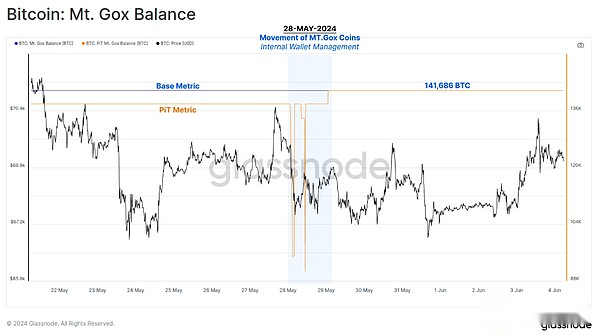
By evaluating the Mt.Gox balance, we can use the Glassnodes point-in-time (PiT) metric to visualize this event.PiT metrics are immutable and use all known wallet clusters when observed to reflect the status of each metric.The standard MtGox balance metric is variable and reflects the best estimates for all time points.
Here we can see internal wallet management, with more than 141,000 BTC transferred in several parts throughout the day on May 28.
Capital flows and composition
The main impact of such a large number of long-term idle currencies being used is that unfiltered metrics such as achieved market capitalization, SOPR and destroyed Coindays will show a significant surge associated with these Mt Gox currencies.In theory, these currencies have been revalued to a higher cost basis during wallet management transactions.
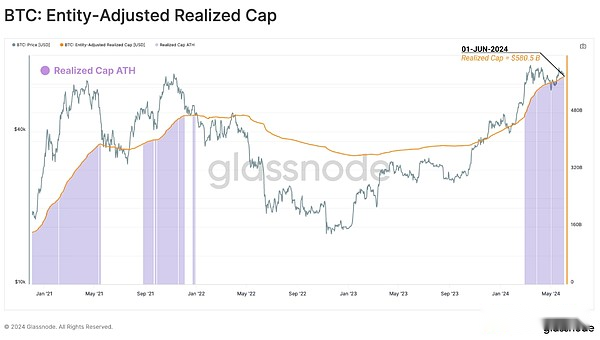
We can use entity adjustment variants that have achieved market capitalization to filter out these uneconomic capital transfers to maintain a clear understanding of Bitcoin capital inflows.The achieved market value is currently at the ATH valuation level of US$580 billion.However, we can see that as the market consolidates, new inflows have slowed since late April.
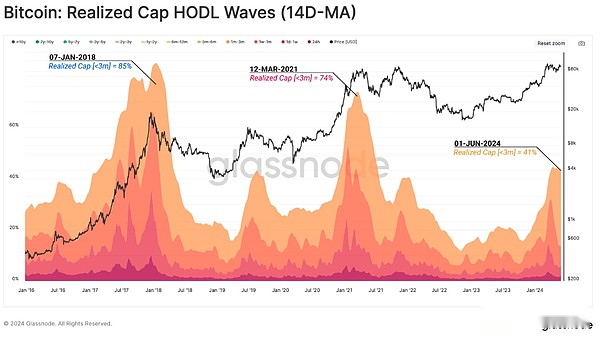
The Realized Cap HODL Waves metric can then be used to examine the overall wealth composition by time.By isolating tokens for less than 3 months, we are able to assess the liquidity ratio held by “new demand”.
This group currently accounts for 41% of online wealth, which proves that wealth distribution is moving towards new demands.This wealth transfer usually reaches more than 70% saturation due to new demand relative to the end of the history of each cycle, indicating a relatively small supply consumed and sold by long-term investors.
While both inflow liquidity and speculative desire have waned in the past two months, the rebound in the $68,000 level has prompted most short-term holders to re-hold unrealized profits.
This shows thatDespite the recent sideways fluctuations in price trends, the cost base of most recent buyers is now more favorable and is lower than the current spot price.
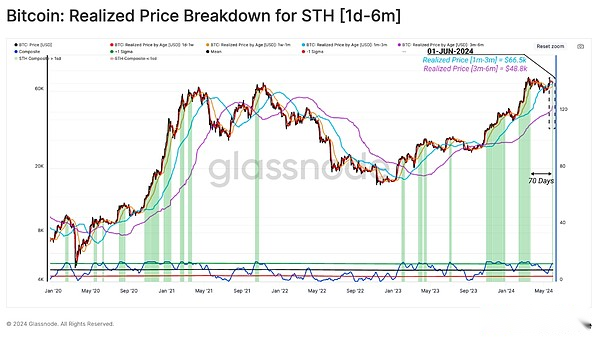
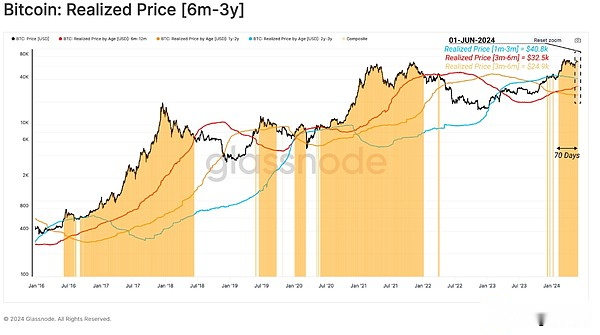
We can study the average buying price over different time periods, and another group worth paying attention to are single-cycle holders (coin age is 6 months to 3 years).We have noticed that all members of the group have held a large amount of unrealized profits since the price breaks through the $40,000 region.
As the price rose to a high of $73,000, the market absorbed a large amount of selling from the group.We can expect that if prices rise, the motive for this group to sell more supplies will increase and further increase their unrealized profits.
Long-term holder market
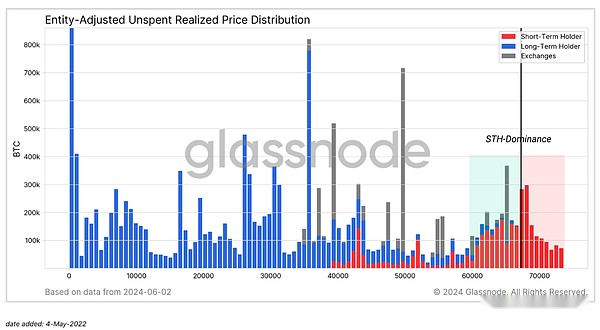
As the market consolidates as it approaches ATH, we can use the URPD indicator to visualize the supply of BTC based on the acquisition cost basis of BTC.
There are a large number of short-term holders tokens accumulating as they approach the current spot price.This indicates a large amount of investments have been made in this price area.However, this brings the risk of an increased sensitivity to price fluctuations in any direction.
Almost all tokens that have not achieved losses belong to the short-term holder group, which makes sense considering ATH close to the previous few cycles.
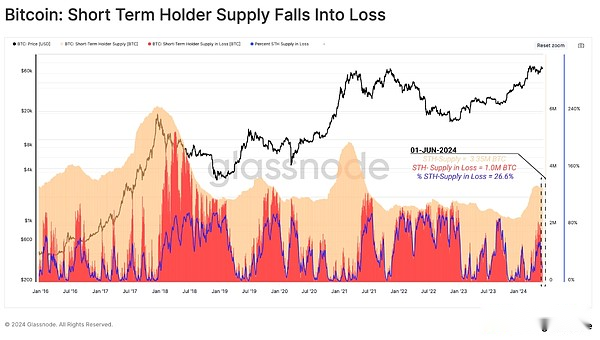
The following figure is a tool that describes the proportion of short-term holders’ losses.This tool can be used to observe when this group exhibits high sensitivity to changes in price behavior, especially when large supply falls into losses in a short period of time.
The market has recently fallen back to $58,000, reflecting a -21% adjustment and its biggest drop since the FTX crash.At this low point, an astonishing 56% (1.9 million BTC) of STH supply went into a loss state.
However, while large supply is technically low, the magnitude of unrealized losses is consistent with a typical bull market adjustment and begins to weaken as the market stabilizes.
Turning to long-term holders, we can see that the total LTH supply at loss is negligible, with only 49,000 BTC (0.03% of LTH supply) above the spot price.Given that the new ATH was set only in March (less than 155 days ago), these lossy LTH tokens are one of the few holders who have bought and held at the top of the 2021 cycle.
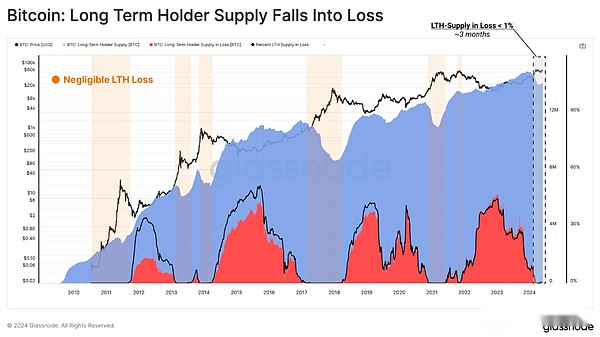
Another visualization method is measured by the proportion of all loss supply, which belongs to the LTH population.At the bottom of the bear market, LTH tends to bear most of the unrealized losses as speculators are driven out of the market and the ultimate surrender leads to a large transfer of token ownership to firm holders.
On the contrary, during the fanatical phase of the bull market, LTH’s contribution to loss supply tends to zero.Meanwhile, STH bears the vast majority of market losses as new demand buys tokens as it approaches local and global price peaks.
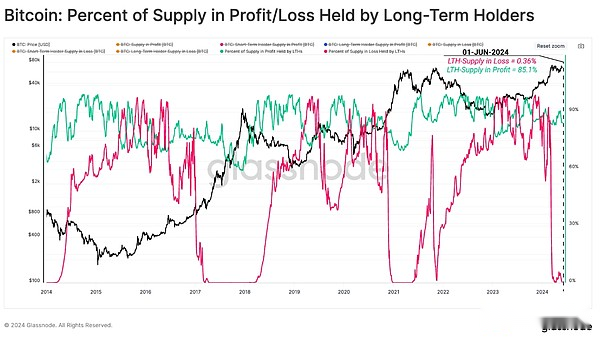
Currently, LTH holds only 0.3% of the lost supply, while subsequent profits account for more than 85% of the supply.
Growth space
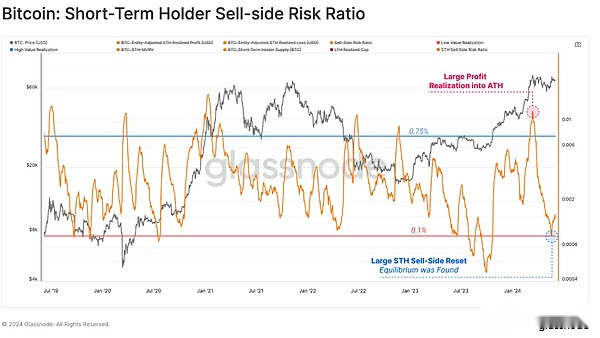
We can investigate their activities by analyzing the consumption behavior of long-term and short-term holders.To do this, we can use the seller risk ratio, which evaluates the relationship between the absolute value of the profit plus loss locked by investors and the size of the asset (measured by actual market capitalization).We can consider this indicator under the following framework:
-
A high value means that when an investor spends tokens, he or she has a large profit or loss relative to his or her cost basis.This situation suggests that the market may need to re-find a balance and will usually occur when prices fluctuate greatly.
-
A low value indicates that most tokens spend relatively close to their break-even cost basis, indicating that a certain level of balance has been reached.This situation usually indicates that the “profit and loss” in the current price range has been exhausted, and usually describes a low volatility environment.
It is worth noting that both profits and losses of the STH group have been reset, indicating that a certain degree of balance has been established during the recent horizontal price consolidation.
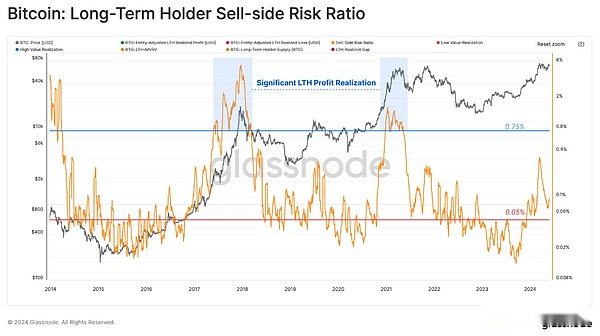
For the long-term holder group, their seller risk ratios rose significantly as profits were taken back until they reached $73,000 ATH.
Historically, however, their seller risk ratio is still at a low level compared to the previous ATH breakout.This meansThe relative margin of profitability of the LTH group is smaller than that of the previous market cycle.This may indicate that the group is waiting for higher prices before increasing its distribution pressure.
Summarize
After months of price consolidation, the dawn of market speculation seems to be returning.New buyers and single-cycle investors mainly hold unrealized profits.This observation is supported by the fact that:Only 0.03% of long-term holders are in a loss state, which is typical of the early stages of the bull market.
In the past 2 months,The seller risk ratio for long-term and short-term holders has been reset and returned to equilibrium.This suggests that most of the profits and losses that may be made in this price range have been achieved and suggests an increased risk of recent large volatility.