Source: Glassnode; Compilation: Baishui, bitchain vision
summary
-
Capital flowing into Bitcoin remains positive, although the inflow has declined since it first hit $100,000.This highlights a period when seller pressure is declining as the market approaches short-term balance.
-
Seller pressure from long-term investors has also declined, and the amount deposited on exchanges for sale has also declined.
-
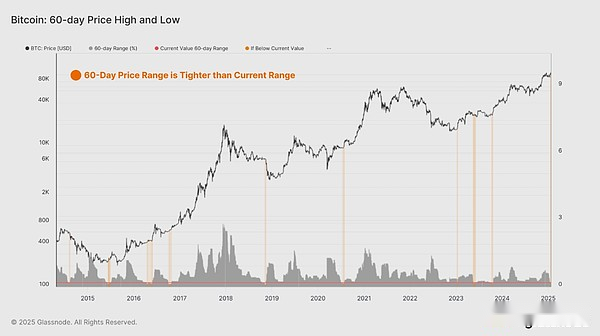
Several volatility indicators are tightening, with market trading in a historically narrow 60-day price range, which usually indicates that the market is almost ready to volatility again.
Capital flows approach equilibrium
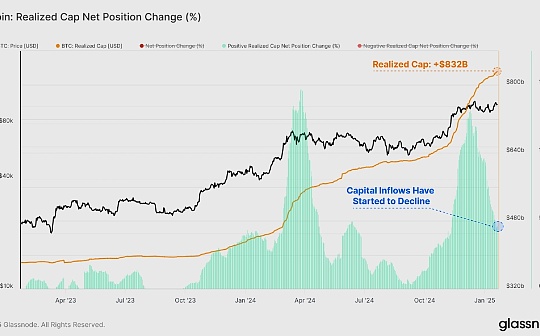
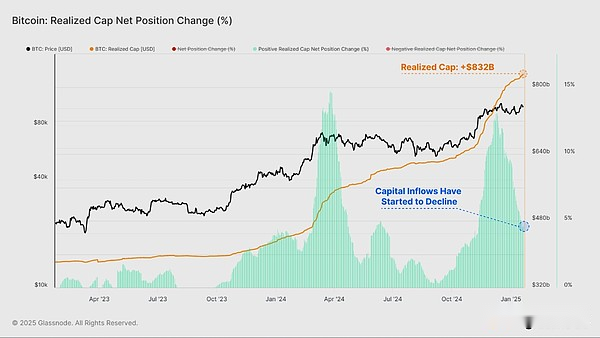
As the price reaches $100,000, Bitcoin’s net capital inflow surges, indicating investors are locking in substantial profits.These capital inflows have begun to decline as the market consolidates and adapts to new price ranges.
The slowdown in profit-taking represents a net decrease in seller strength, so less new capital is needed to maintain the price within the trading range.
Currently, the actual market capitalization is trading at $832 billion and is growing at a rate of $38.6 billion per month.
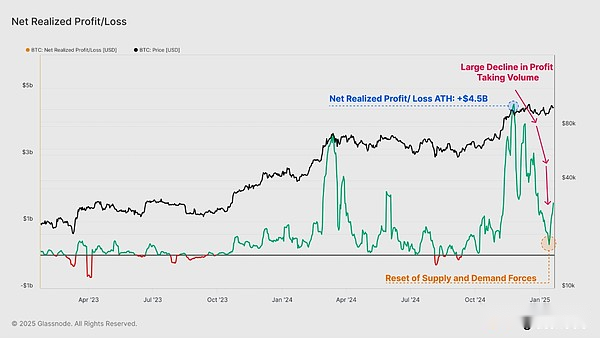
The net realized profit/loss indicator is the first derivative of realized market capitalization, allowing us to discretely observe the scale of on-chain net capital flows denominated in USD.
As the market digests the distribution pressure of profit-taking and loss, the balance between profit and loss has gradually become a neutral position.This indicates that supply and demand forces are resetting and that most of the tokens currently traded do not lock in larger increments of value relative to the price of the first acquisition.
Profit returns peaked at +4.5 billion in December 2024 and have now dropped to +316.7 million (-93%).
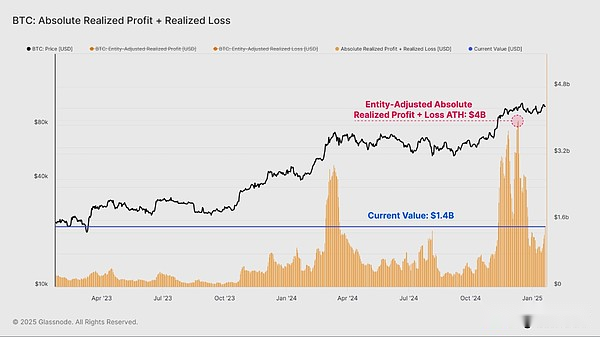
The absolute amount of realized profits and realized losses (entity adjusted) is another set of tools that help us measure the direction and sentiment of capital inflows and outflows of Bitcoin.
When we add together the realized profits and losses, we can see that this composite metric has dropped sharply from a high of $4 billion to a value of $1.4 billion.Despite a 65% drop, from a historical perspective,The current value is still high, highlighting the scale of daily demand for absorbing these capitals during the bull market.
Supply side slows down
We have confirmed that overall seller pressure has dropped significantly.We can further study these dynamics using indicators such as Coinday Destruction and exchange inflows to confirm this view.
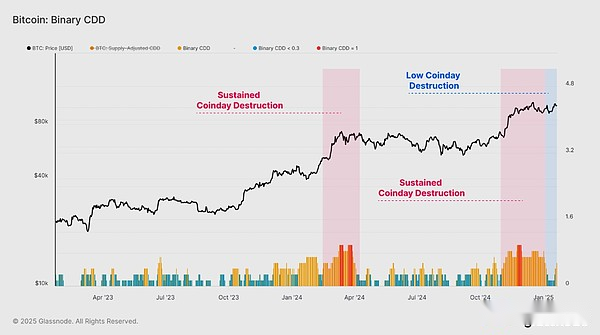
The first tool we can use to better describe the pressure of investors assigning is the Binary CDD indicator.The indicator tracks “holding time” spending across the market, tracking when old supply holders trade more and more.
We saw a persistent period of severe coinday destruction in late 2024 and early January.This indicator has begun to cool down in recent weeks as relatively light coinday destruction has dominated.
This shows thatInvestors who plan to make profits may have already taken profits within the current price range.Generally speaking, this suggests that the market may need to “turn elsewhere” to attract and unlock the next wave of supply.
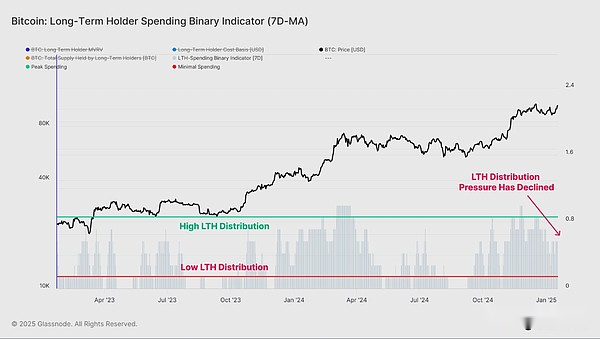
The Long-Term Holder (LTH) Binary Expenditure metric is another indicator we can use to evaluate the duration of ongoing seller stress.This tool is specifically designed for long-term investors.
Consistent with the massive profit-taking volumes before, we can see that the total LTH supply dropped significantly as the market reached $100,000 in December.The rate at which LTH supply has declined has since stalled, indicating that this distribution pressure has weakened in recent weeks.
Currently, the total LTH supply is starting to show signs of a rebound, indicating that for this group, accumulation and HODLing behavior are now greater than the distribution pressure.
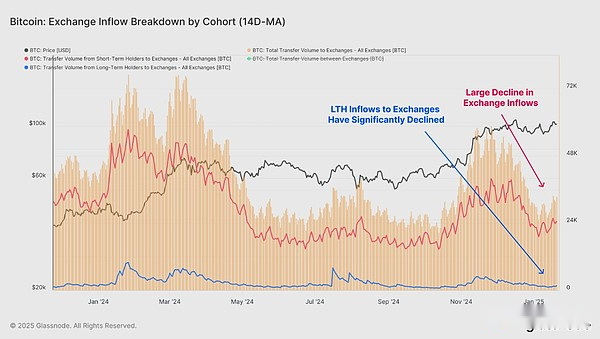
Centralized exchanges remain the primary venue for speculation and trading, processing billions of dollars in funding flows every day.Exchange inflows have dropped sharply from a peak of $6.1 billion to $2.8 billion (-54%), highlighting the significant reduction in recent speculation.
It is worth noting that the amount of funds flowing into the exchange by LTH has dropped from $526.9 million in December to $92.3 million at present, with deposits falling by -83%.
This further supports the following argument:Long-term investors may have completed a large amount of profit-taking within this price range.
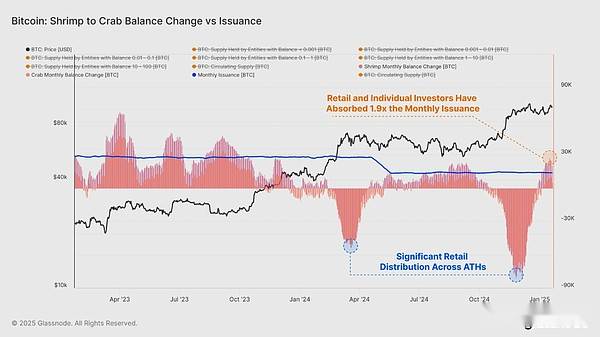
To further analyze the supply and demand balance, we can compare the balance change rate of different groups and standardize it to BTC mining volume.This provides a relative measure of new issuances theoretically absorbed by each cohort.
With the shrimp and crab group (holding <10 BTC) as representative of retail and individual investors, we noticed that this group has absorbed about +25.6k BTC in the past month.By comparison, miners issue about +13.6k BTC per month.
As a result, these retail investors and individual holders actually absorbed 1.9 times the new supply that entered the market through primary production.
Coiling fluctuations
It can be seen that there is a strong fusion between the two on-chain models and the historically narrow 60-day price range, allowing investors to seize the situation of intensifying volatility.
By measuring the percentage range between the highest and lowest prices in the past 60 days, we can see how market volatility changes over time.The following figure highlights the period when the 60-day price range is narrower than the current trading range.All of these happen before a large outbreak of volatility, most of which occur early in a bull market or before selling later in a bear market cycle.
Continuous horizontal price trends over a narrow range allow a large portion of circulation supply to be redistributed and concentrated on a relatively high cost basis.
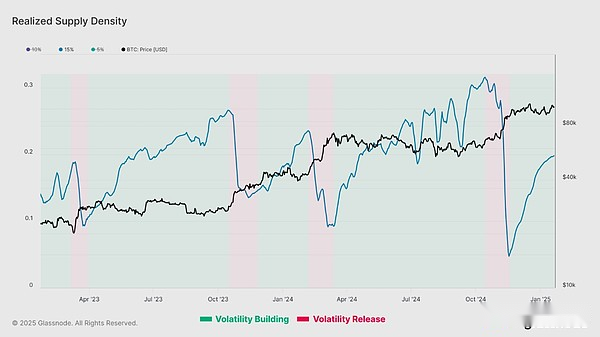
The actual supply density index quantifies the supply concentration of the current spot price within the range of ±15% price change.When supply is highly concentrated near spot prices, slight fluctuations in prices will significantly affect investors’ profitability, thereby aggravating market volatility.
After the Bitcoin price peaked in December, it began to consolidate, forming a intensive supply concentration with a cost base close to the spot price.Currently, 20% of the supply is within ±15% of the spot price.
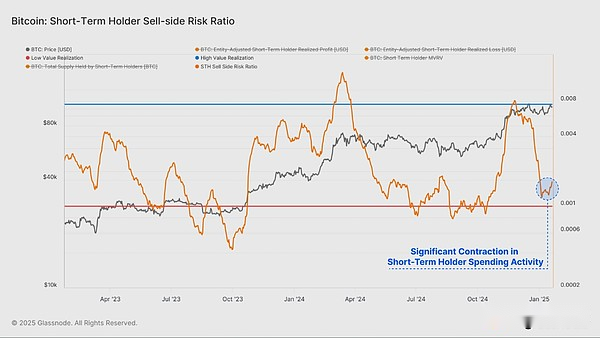
Seller risk ratio describes this phenomenon from different perspectives.This indicator evaluates the proportion of the total realized profit and loss locked by investors with respect to the size of assets (measured by the realized market capitalization).We can consider this indicator under the following framework:
-
A high value means that when an investor spends a token, it has a large profit or loss relative to its cost basis.This situation suggests that the market may need to re-find a balance and will usually occur after a high volatility price action.
-
A low value indicates that most tokens spend relatively close to their break-even cost basis, indicating that a certain level of balance has been reached.This situation usually indicates that the “profit and loss” in the current price range has been exhausted, and usually describes a low volatility environment.
Short-term holders’ spending activity has contracted dramatically in recent weeks, leading to a sharp decline in seller risks.This usually means that all profit and loss events planned by the investor are now executed.It often indicates that the market is close to local equilibrium and is a precursor to the next wave of fluctuations.
Summarize
Bitcoin price experienced a sharp intraday fluctuation, first soaring to a new high of $109,000, then plummeted, and then stabilized above $100,000.The macro context before and during the inauguration of the U.S. presidential inauguration is challenging and uncertain, exacerbating the level of market hesitation.
In this article, we evaluate and analyze conditions before explosive but volatile price movements.We propose a framework to identify signs of imminent volatility using the reduction in on-chain transaction volume and capital flows and tightening of price ranges.