Author: UkuriaOC, CryptoVizArt, Glassnode; Compilation: Wuzhu, bitchain vision
summary:
-
On average, BTC investors’ unrealized losses were relatively small compared to previous cycles, indicating a relatively favorable overall situation.
-
However, the unrealized losses of short-term holders remain quite high, indicating that they are the main risk group.
-
Profit and loss activity remains very little, with key indicators such as seller risk ratios suggesting that volatility may intensify in the near term.
The market is down
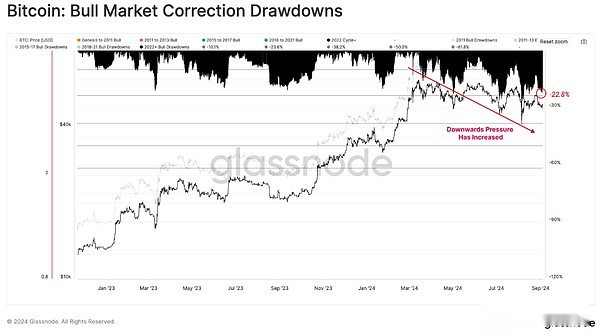
Price trends have stagnated and investors are in a downturn in the past six months.However, significant changes have occurred in the past three months, with increasing downward pressure, resulting in the market experiencing the worst decline of this cycle.
However, from a macro perspective, spot prices are currently around 22% lower than the historical high, and the decline is relatively small compared to the historical bull market.
Current market pressure
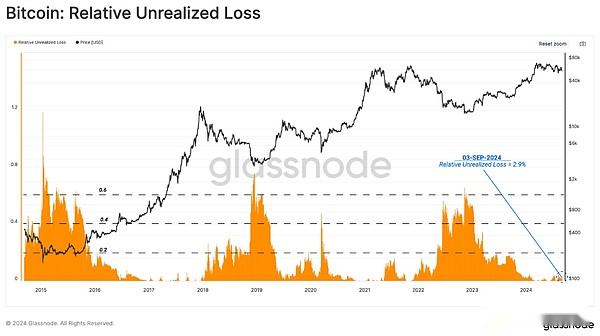
As price downward pressure increases, it is wise to assess the unrealized losses held by investors to assess the financial pressure they are experiencing.
From a broader market perspective, unrealized losses remain at historical lows.Total unrealized losses accounted for only 2.9% of Bitcoin’s market value, at a historical low.
This shows that investors in general are still relatively profitable even as prices continue to fall.
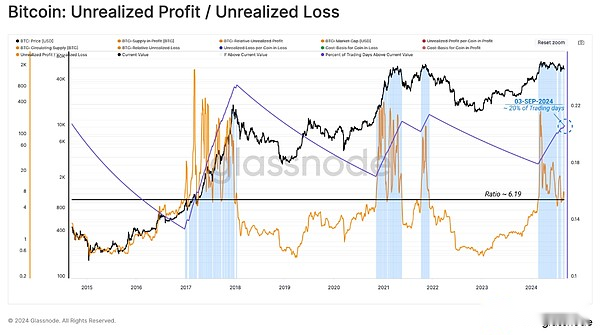
If we take the ratio of the total unrealized profit to the total unrealized loss, we can see that the profit is still 6 times the total loss, supporting the above observations.The ratio is higher than the current value on about 20% of the trading days, highlighting the surprisingly solid financial situation of the average investor.
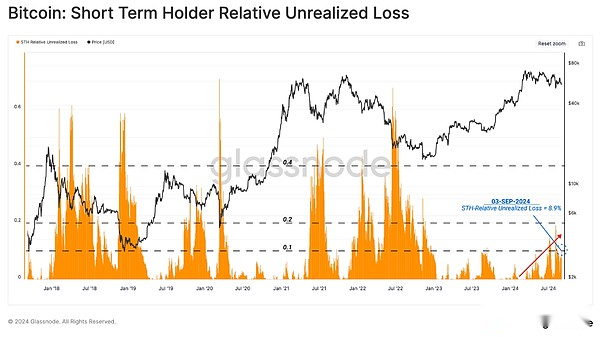
Short-term concerns
The short-term group of holders representing new market demand seems to be under most of the market pressure.Their unrealized losses dominate, and over the past few months, their size has continued to increase.
However, even for this group of people, their unrealized losses have not yet entered a full-scale bear market relative to their market capitalization, and are closer to the turbulent 2019.
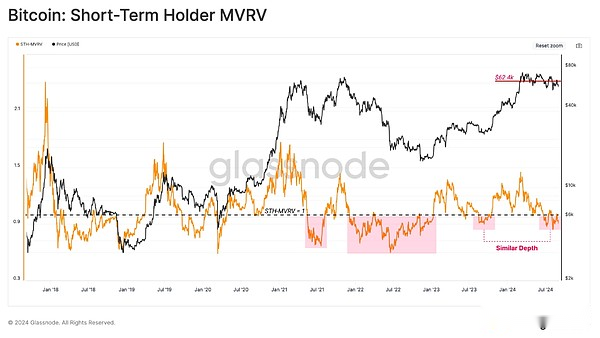
We can support the above observation by evaluating the STH MVRV ratio, which has fallen below the breakeven value of 1.0.During the recovery rebound after FTX failure, the indicator’s trading levels were similar to August 2023.
This tells usOrdinary new investors hold unrealized losses.Generally speaking, the market is expected to be further weaker before spot prices recover to the $62,400 STH cost base.
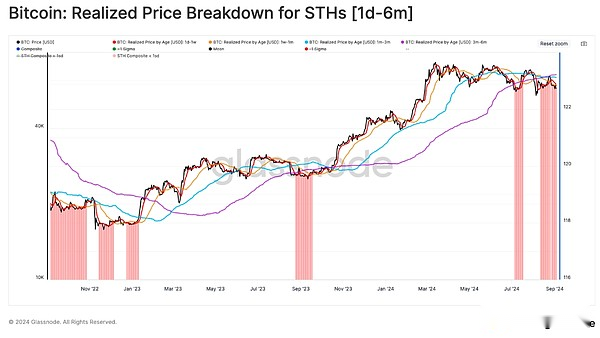
We can enhance confidence in this assessment by examining a subset of the STH investor community.Currently, all age groups in the STH population hold unrealized losses, with an average cost basis as follows:
1d-1w: $59.0k (red)
1w-1m: $59.9k (Orange)
1m-3m: $63.6k (blue)
3m-6m: $65.2k (purple)
Investor reaction
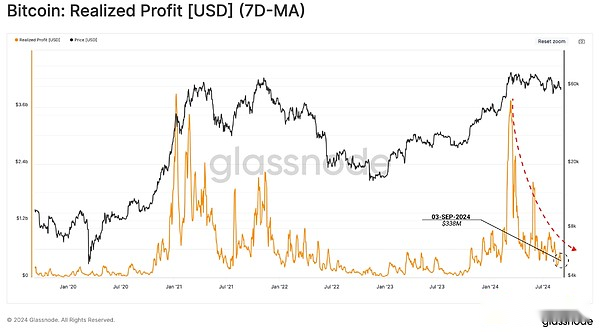
Evaluating unrealized losses provides insight into the pressures faced by market investors.We can then supplement the analysis of realized profits and losses (lockdowns) to better understand how these investors respond to this stress.
Starting from the realized profit, we can seeA sharp drop occurred after the all-time high of $73,000, suggesting that most tokens spent since then locked in smaller and smaller amounts of profits.
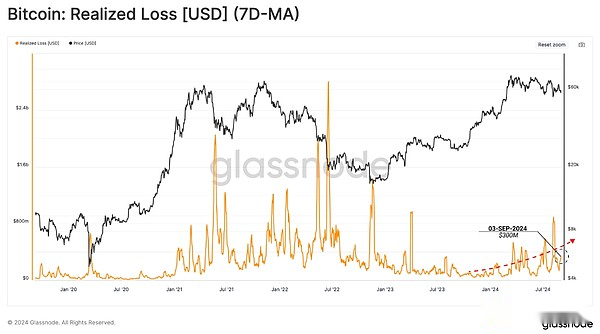
Turning to realized losses, we noticedLoss events have increased, and trading volume is rising to higher levels as the market downward trend advances.
Loss events have not yet reached the extreme levels during the mid-2021 sell-off or 2022 bear market.However, the gradual higher trend does indicate that some fear is spreading into investors’ behavior patterns.
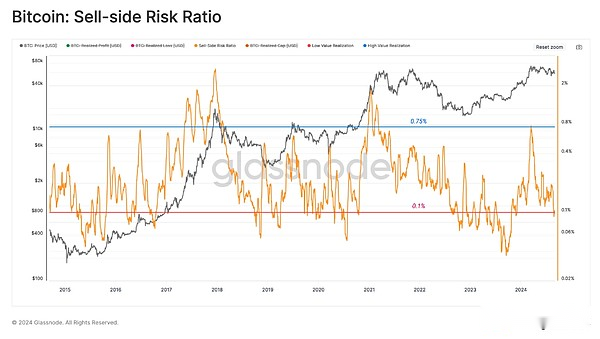
From the perspective of seller risk ratio, we can see that the total realized profit and loss are relatively small compared to the overall market size.We can explain this indicator under the following framework:
-
A high value indicates that the investor spends the token’s profit or loss relative to its cost basis.This situation suggests that the market may need to re-find a balance and will often follow a high volatility price trend.
-
A low value indicates that most tokens spend relatively close to their break-even cost basis, indicating that a certain level of balance has been reached.This situation usually indicates that the “profit and loss” in the current price range has been exhausted, and usually describes a low volatility environment.
The seller risk ratio has dropped to a lower level, indicating that the token price for most on-chain transactions is very close to its original purchase price.This indicates that profit and loss activity is gradually saturated within the current price range.
Historically, this suggests expectations of increased volatility in the short term, similar to what happened in 2019.
Control cycle
In the downward trend, patience and holding have become the dominant market trends.A large number of long-term holders tokens were spent to earn profits of March ATH, resulting in a net oversupply.
LTH has slowed its profit-taking rate recently, with supply accumulated during the ATH rise gradually matured into long-term holders.However, historically, examples of increased LTH supply like this suggest that this usually occurs during the transition to a bear market.
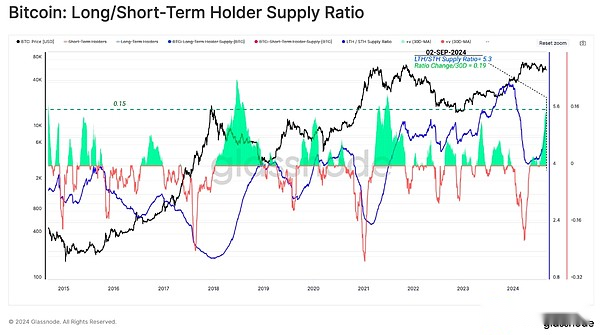
Based on the above observations, we noticed thatAs the token matures and turns into long-term holders, wealth held by new demand investors has declined in recent months.
The percentage of wealth held by new investors does not reach the high limit experienced during previous ATH allocation events.This may indicate that the peak in 2024 is more in line with the mid-cycle highs of 2019 than the macro highs in 2017 and 2021.
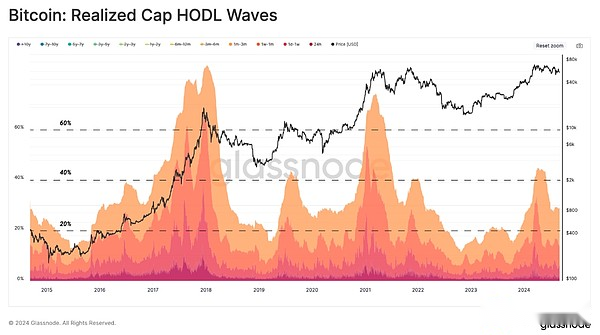
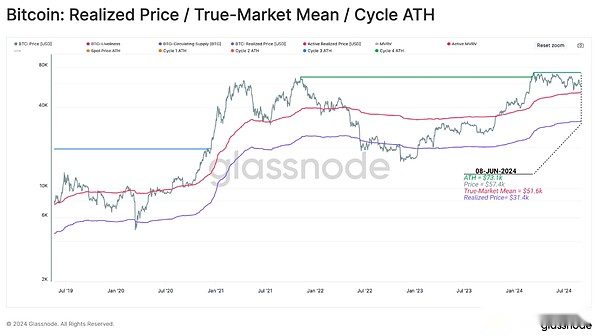
To summarize our analysis, we will refer to a simplified framework that uses key on-chain pricing levels to think about historical Bitcoin market cycles:
Deep bear market: Price is lower than actual price.(red)
Early bull market: Prices trade between actual prices and real market averages.(blue)
Hot Bull Market: Prices trade between ATH and real market averages.(Orange)
Euphoric Bull Market: Prices are higher than ATH in previous cycles.(green)
Under this framework, the price trend is still within the enthusiastic bull market structure, which is a constructive observation.However,In the event of a local downturn, the $51,000 pricing level remains a key area of concern and this level must be maintained for further appreciation.
Summarize
Bitcoin has only fallen back from its all-time high at 22%, much smaller than the previous cycle.Ordinary BTC investors are still profitable, highlighting the robustness of their positions.
despite this,The short-term group of holders continues to bear higher unrealized losses, indicating that they are the main risk group and are also the expected source of seller pressure during economic downturns.
besides,Profit and loss activity remains very little, indicating that our current range is saturated, and key indicators such as seller risk ratios are saturated, suggesting that volatility may intensify in the near term.