
Source: Glassnode; Compilation: Baishui, bitchain vision
summary
-
Bitcoin’s dominance has continued to climb since its cyclical low in November 2022, and now accounts for 56% of the total market capitalization of cryptocurrencies.
-
Despite the volatile price volatility, long-term holders remain unwavering in their beliefs, with their obvious tendency to accumulate and hold tokens.
-
Short-term holders have suffered most of the losses during the recent downturn.However, the extent of lockdown loss suggests that they may have overreacted to this event.
Market Overview
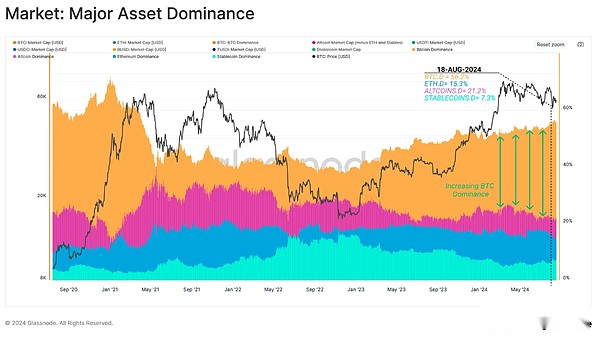
Since the cyclical lows hit in November 2022, capital has continued to accumulate on the main asset side of the digital asset risk curve.Bitcoin’s dominance has risen from 38% in November 2022 to 56% of the entire digital asset market today.
As the second largest asset in the ecosystem, Ethereum’s dominance fell by 1.5%, and has remained relatively stable over the past two years.Stablecoins and wider altcoins experienced a more significant decline of 9.9% and 5.9% respectively.
Bitcoin dominance: 38.7% (November 2022) —> 56.2% (current) (red)
Ethereum dominance 16.8% —> 15.2% (blue)
Stablecoin dominance 17.3% —> 7.4% (green)
Altcoin dominance 27.2% —> 21.3% (purple)
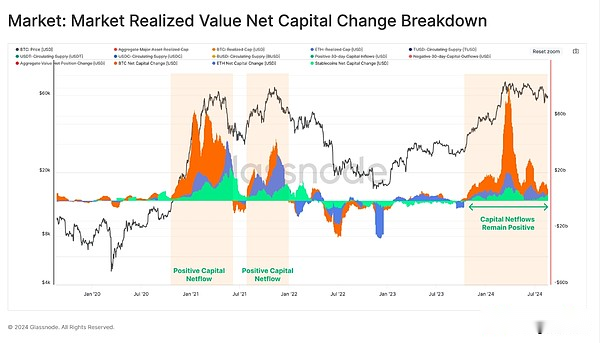
However, when we evaluate the net capital changes in major assets, Bitcoin, Ethereum and stablecoins all show net positive capital inflows.Although the market generally shrank since its all-time high in March, only 34% of the trading days saw a larger 30-day dollar inflow.
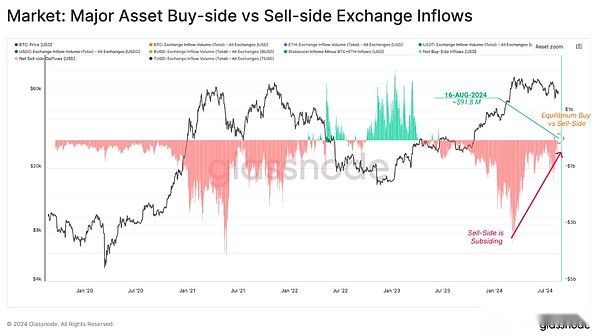
Next, we can use the main asset buyer and seller indicator, which is designed to identify transfers of capital based on exchange inflow preferences.This can be considered under the following framework:
Values close to zero indicate a neutral mechanism where buyer inflows are the same as BTC+ETH seller inflows.
Positive values indicate that there is a net buyer mechanism in which buyer inflows of stablecoins exceeds BTC+ETH seller inflows.(green)
Negative values indicate the existence of a net seller mechanism where the buyer inflow of stablecoins is less than the BTC+ETH seller inflow.(red)
Seller pressure has waned since the new ATH was set in March 2024 and is currently recording the first positive data point since June 2023 ($91.8 million per day).
Long-term holders
In the recent turbulent market environment, long-term holders lock in stable profits of $138 million a day.Each transaction matches buyers and sellers, solving the problem of supply and demand imbalance through price changes.
Therefore, we can infer that the pressure on LTH sellers about $138 million a day indicates the need to absorb supply and keep prices stable in order to obtain daily capital inflows.Although market conditions are volatile, prices have generally remained flat over the past few months, indicating that some equilibrium is being reached.
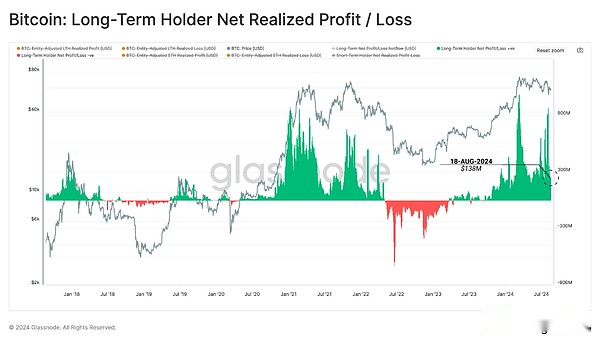
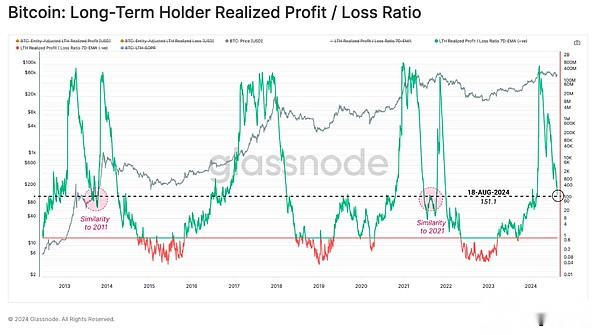
The actual profit/loss ratio of long-term holders is an indicator we can use to evaluate the cyclical behavior of this group.We noticed that despite the sharp drop in the indicator from its peak, it was still at a high level.This suggests that long-term investors are cooling down profit-taking activities.
It is worth noting that during the ATH period in March 2024, the indicator reached a height similar to the previous market highs.During the 2013 and 2021 cycles, the indicator dropped to similar levels before resuming the price uptrend.However, in 2017-18, this decline was one-way as the market entered a loss-dominated bear market.
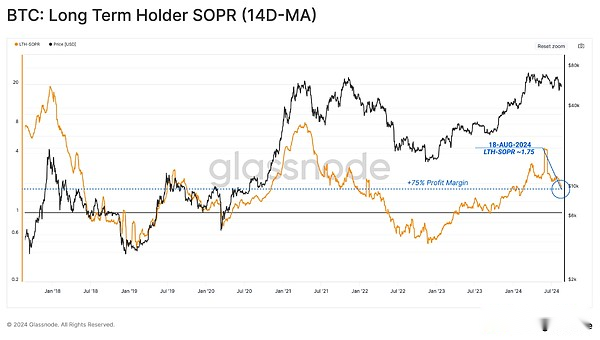
From the perspective of long-term holder SOPR, we can see that the average profit margin for token locks is +75%, and LTH-SOPR is still at a high level at this time.
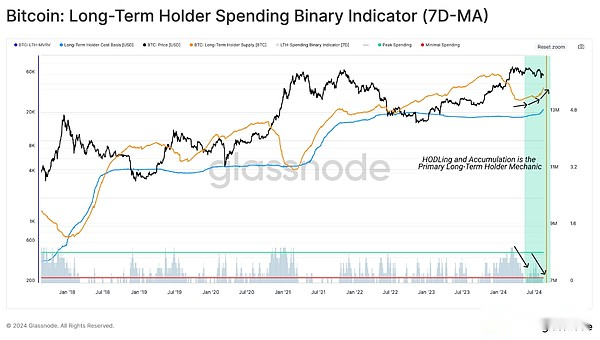
Using our LTH binary spending indicator, we can see the slowdown in spending for long-term holders mentioned above.
LTH supply is currently increasing rapidly.When we consider that the 155-day threshold for the LTH state is close to the March ATH, this indicates that the supply obtained during the ATH rise remains in hold.This highlights that holding behavior significantly exceeds spending behavior.
Psychological Relevance
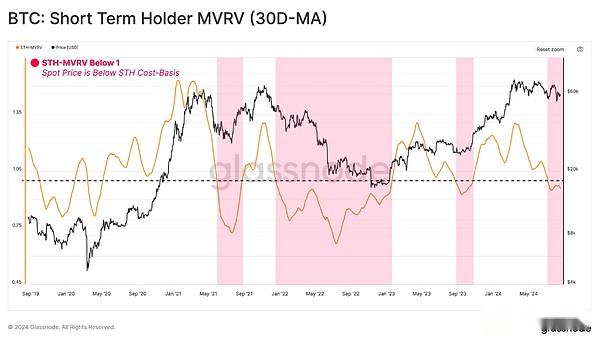
Turning to the opposite group, i.e. short-term holders, we can measure the intensity of unrealized financial stress experienced by buyers in the near future.We can observe this dynamic using the STH-MVRV ratio metric and apply a 30-day average.
STH-MVRV has recently contracted below the equilibrium of 1.0, indicating that the average new investor now holds unrealized losses.
During a bull market, short periods of unrealized losses are common.However, periods where STH-MVRV trading prices continue to fall below 1.0 may lead to higher chances of investor panic and herald a more severe bear market trend.
As unrealized losses increase, expectations of investors’ final sell-offs are also growing.Such events are characterized by locking out significant losses by spending tokens.
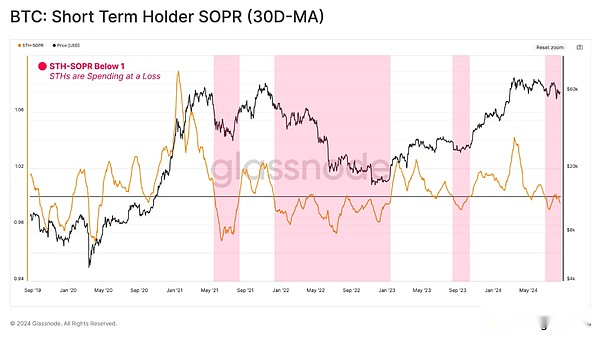
When STH-SOPR trading is below 1.0, it can be seen that new investors achieve high losses in the market.
From this perspective,We can also see that STH-SOPR trading is below 1.0, indicating that new investors have achieved some level of loss-making activity.This further suggests that the market is at a decision point, with a price slightly below the comfort point of STH.
Despite the correlation between unrealized and realized activities, new investors may overreact to their portfolio holding relatively high unrealized profits (or losses).This overreaction is a key feature of the market, and the emotional reaction of investors causes them to achieve excessive profits (or losses) at the inflection point, forming local and macro tops (or bottoms).
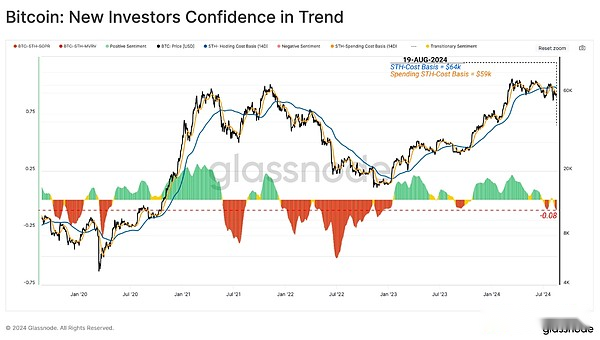
The following figure compares the expenditure cost basis for new investors who decide on the transaction with the average cost basis for all investors who are still holding.The deviation between these two indicators provides insight into the extent of potential overreaction.
The bull adjustments we see in our current cycle have experienced only a slight deviation between the expenditure and the cost of holding basis.Therefore, it can be said that as the market falls below $50,000, a moderate overreaction may occur.
Controlling the investor cycle
In the previous section, we used MVRV and SOPR indicators that took into account the overall profit and loss of investors.This section will analyze only the tokens held and traded in losses.
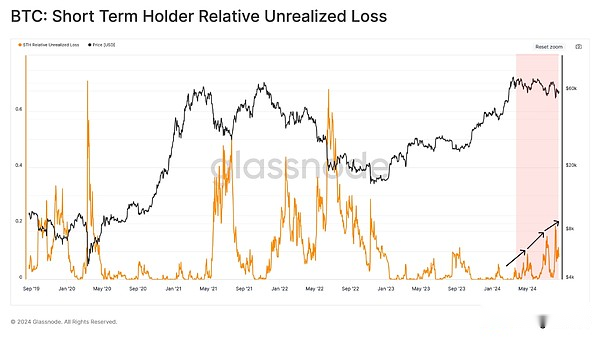
By evaluating the relative unfulfilled loss indicators of new investors, we can directly measure the unfulfilled financial pressures that new investors bear.
at present,The unrealized losses remain relatively low relative to STH’s market cap compared to historical sell-off events.The loss range of market holdings can be said to be similar to the previous bull market adjustment.
However, when we compare the accumulation of unimplemented losses with losses locked with tokens (implemented losses), we can see that this correlation is divergent.The achieved losses are significantly higher, highlighting the modest overreaction we described above.
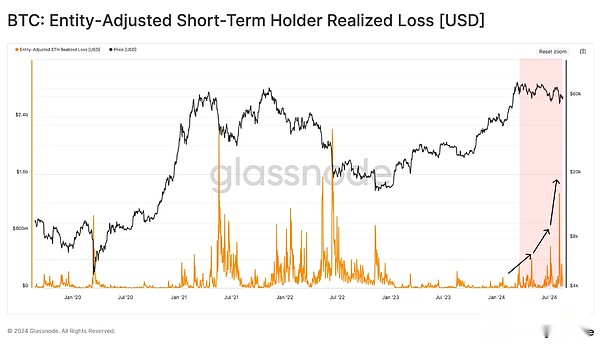
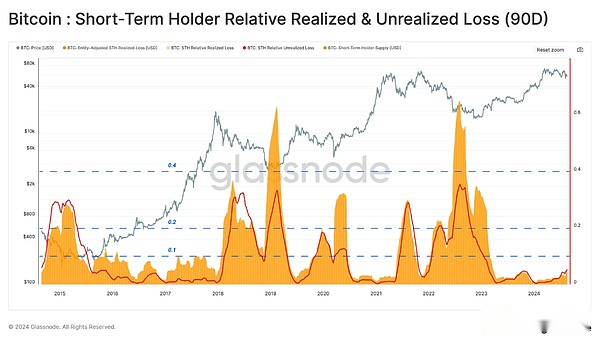
By evaluating the cumulative 90-day achieved losses and average unrealized losses for STH, we can intuitively highlight the fusion and correlation between these two indicators.
During periodic price lows, the magnitude of realized and unrealized losses tends to soar between 10% and 60% of STH’s total holdings.By this measure, the magnitude of unrealized and realized losses remains relatively small compared to previous major bottom formation events.
A constructive analogy is the similarity between the current structure and the 2016-2017 cycle, where the relative indicators described are below a consistent upper limit of approximately 10%.
From this, we can say thatThe blow to investor sentiment may not be as severe as it seems.
Summarize
Due to the widespread uncertainty among market investors, capital continues to flow along the risk curve, resulting in a significant expansion of Bitcoin’s dominance., this leading asset currently accounts for 56% of the total market value.
Despite the turbulent price trends,Long-term holders remain firm in their determination, and they are clearly inclined to hold and buy tokens.on the other hand,Short-term holders have borne the vast majority of losses in the recent market downturn.despite this,The extent of lockdown loss indicates that they may have overreacted to this event.