Source: Glassnode; Compilation: Baishui, bitchain vision
summary
-
The macroeconomic environment remains uncertain and global trade relations are being reorganized.This uncertainty has led to increased volatility in the U.S. Treasury market and stock markets.
-
Faced with the severe economic situation, Bitcoin hit its biggest drop since the cycle.Nevertheless, this is within the typical range of previous adjustments during the bull market.In addition, the median decline in this cycle is still an order of magnitude lower than the previous cycles, highlighting that the demand situation is more elastic.
The liquidity of the entire digital asset ecosystem continues to tighten, reflected in the decline in capital inflows and the stagnation of stablecoin growth.
-
Investors are under considerable pressure and are currently facing the largest unrealized losses on record.However, most of these losses are concentrated on newer market participants, while long-term holders generally remain profitable.
Macro uncertainty remains widespread
The macroeconomic situation is full of uncertainty, and the Trump administration’s goal is to subvert and reorganize the status quo of global trade relations.Currently, U.S. Treasury bonds are collateral and foundations of the financial system, and 10-year Treasury bonds are considered as the benchmark risk-free interest rate.
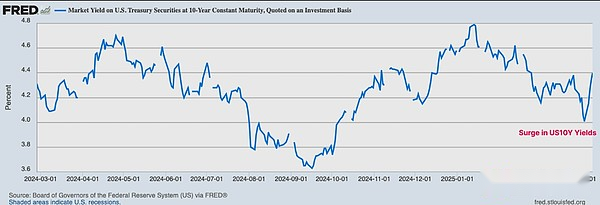
A major goal of the government is to lower the 10-year Treasury yield and has achieved initial success in the first few months of the year, with yields falling to 3.7% as wider markets sell off.However, this was only brief, as yields subsequently rebounded to 4.5%, erasing the progress and causing huge volatility in the bond market.
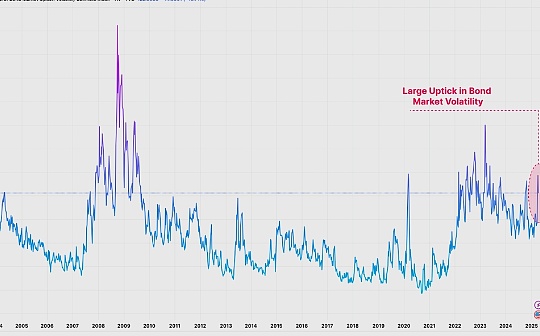
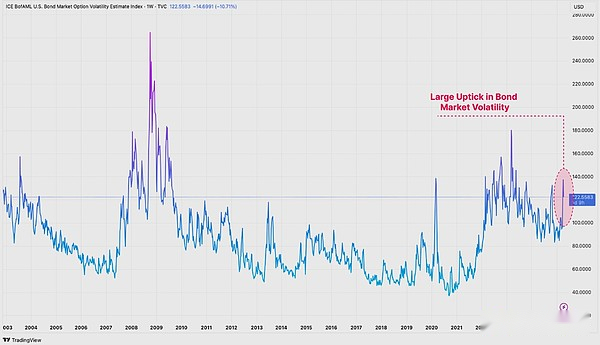
We can quantify disorderly behavior in the bond market through the MOVE index.This indicator is a key indicator of bond market pressure and volatility, and the implicit 30-day volatility in the U.S. Treasury market is calculated based on option prices for different periods.
By this measure,The volatility of U.S. Treasury has increased significantly, highlighting the extreme uncertainty and panic among investors in bond markets.
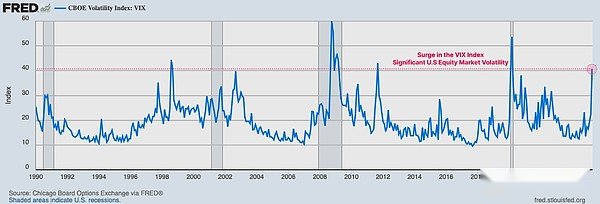
We can also use the VIX index to measure the level of chaos in the U.S. stock market, which measures market expectations for 30-day volatility in the U.S. stock market.The volatility of the bond market is also clearly reflected in the stock market, with VIX currently recording volatility values similar to those during the 2020 COVID-19 crisis, the 2008 global financial crisis, and the 2001 Internet bubble period.
Volatility in the basic collateral of the financial system often leads to pullbacks in investor capital and tightening of liquidity conditions.Given that Bitcoin and digital assets are one of the most liquid-sensitive tools, they are naturally affected by the decline in volatility and risky assets.
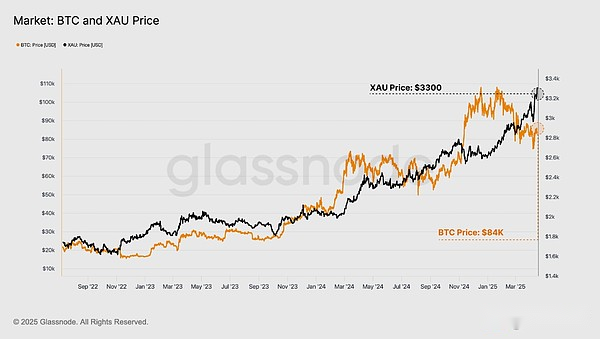
The performance of hard assets remains impressive amid this turmoil.Gold prices continued to soar, hitting a new high of $3,300 as investors flocked to traditional safe-haven assets.Bitcoin was initially sold to $75,000 along with risky assets, but has since recovered for weeks, trading back to $85,000, a flat since the volatility.
As the world adapts to changing trade relations, gold and Bitcoin are increasingly entering the center stage as global neutral reserve assets.So one can say that the performance of gold and Bitcoin in the events last week sent a fascinating signal.
Bitcoin remains strong
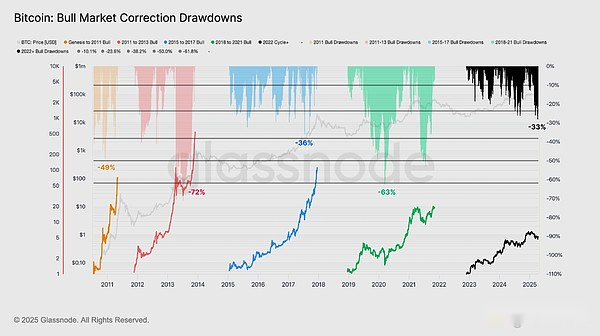
Although impressively Bitcoin is still trading within the $85,000 region, leading digital assets have experienced drastic volatility and declines in recent months.The asset recorded its biggest drop in the 2023-25 cycle, with the largest pullback down -33% from its all-time high.
However, the decline remains within the typical range of previous adjustments during the bull market.Bitcoin usually experiences over -50% sell-offs in previous macroeconomic events such as last week, highlighting a degree of robustness in modern investors’ sentiment towards the asset under adverse conditions.
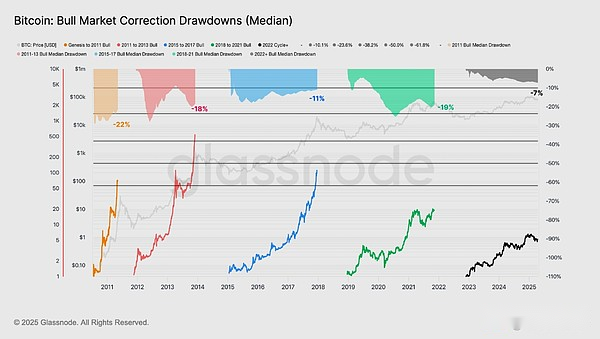
To quantify the elasticity of the current cycle, we can evaluate the rolling median retracement of all bull structures.
-
2011: -22%
-
2011-13: -18%
-
2015-18: -11%
-
2018-21: -19%
-
2022+: -7%
The median retracement in the current cycle is much smaller than in all previous cases.Bitcoin’s decline has become smaller and inherently more controllable since 2023, indicating a more resilient demand situation and that many Bitcoin investors are more willing to hold during market turmoil.
Liquidity continues to shrink
We can also evaluate how macro uncertainty affects Bitcoin’s liquidity status.
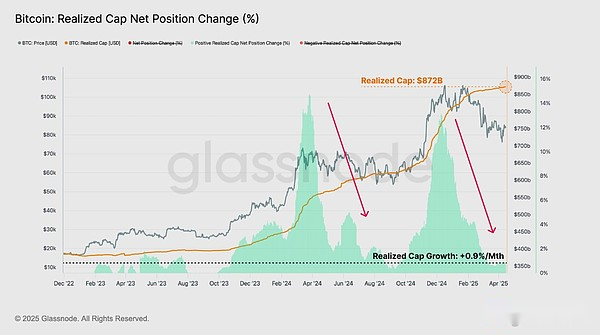
We can measure the internal liquidity of Bitcoin through the implemented capital metric, which calculates the cumulative net capital flows into digital assets.The transaction price of realized capital reached an all-time high of $872 billion, however, the rate of capital growth has been compressed to just +0.9% per month.
In the context of a challenging market, it is impressive that the capital flowing into the asset remains positive.Given that new capital entering the asset is slowing, it also indicates that investors are currently less willing to allocate capital in the short term, suggesting that risk aversion may remain the default behavior for the time being.
The realized profit and loss indicators are the input components of the realized market capitalization, allowing us to measure the difference between the acquisition price of a token and its value when used on-chain.
-
Tokens spent above the acquisition price are considered to lock in realized profits.
-
Tokens below the acquisition price are considered locked to have realized losses.
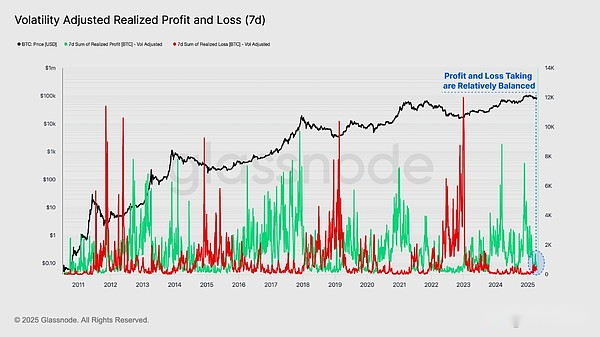
By measuring realized profits and losses in units of BTC, we can standardize all profit and loss events corresponding to Bitcoin’s cyclical expansion of market capitalization.Here we introduce a new variant that is further refined by adjusting for volatility (7-day actual volatility), which helps explain the diminishing returns and growth rates of Bitcoin as it matures over its 16-year history.
At present, profit and loss activities are relatively balanced, resulting in the aforementioned relatively neutral inflow rate.It can be argued that this reflects the saturation of investor activity in the current price range and often prevents a period of consolidation when the market tries to find a new balance.
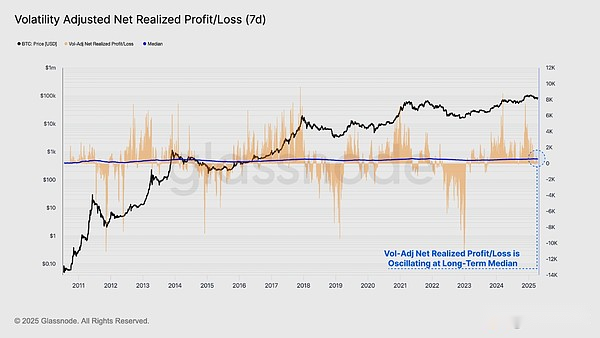
By calculating the difference between realized profit and realized loss, we can derive a net realized profit/loss indicator.This metric measures the directional dominance of the value of inflow/outflow networks.
Using the volatility-adjusted net realized profit/loss indicator, we can compare it with the cumulative median to distinguish the two market mechanisms.
-
Continuously above the median value usually indicates a bull market and net capital inflows.
-
Values that continue to fall below the cumulative median are usually considered a bear market, and Bitcoin will experience a net capital outflow.
Markets often push investors to the brink of greatest pain, often peaking at the turning points of bull and bear cycles.We can see how volatility-adjusted net realized profit/losses volatility volatility around its long-term median, acting as a means regression tool.
The indicator has now been reset to the neutral median, indicating that the Bitcoin market is currently at a critical decision point and has set boundaries for bulls to re-establish support levels in the current price range.
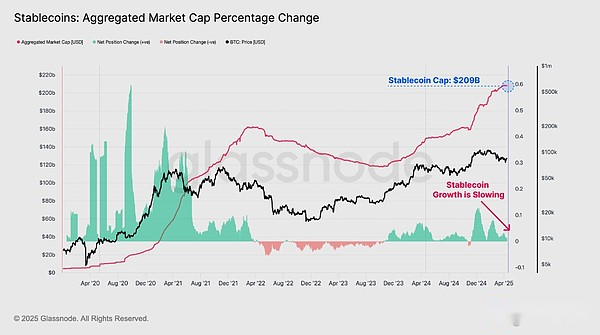
Stablecoins have become the underlying asset class in the digital asset ecosystem, as quotation assets for trading in centralized and decentralized trading venues.Evaluating liquidity through a stablecoin perspective provides an additional dimension to our analysis, providing an overall perspective on the liquidity status of digital assets.
The growth in stablecoin supply has remained positive, but has slowed in recent weeks.This further demonstrates that broader digital asset liquidity has shrunk, measured by the weakening demand for digital native dollars.
Check investor pressure
In the midst of ongoing market turmoil, it is important to assess the scale of unrealized losses currently held by Bitcoin investors.
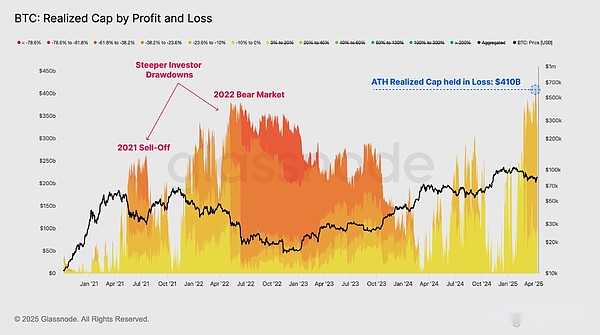
When measuring the actual market cap of the loss-making supply, we noticed that it had reached an all-time high of $410 billion during the period when the market fell to $75,000.When we examine the composition of unrealized losses, we can see that most investors hold losses as high as -23.6%.
Currently, the actual supply of losses held is even greater than the sell-off in May 2021 and the bear market in 2022.However, it is worth noting that from the perspective of individual investors, the market has experienced a greater decline, as high as -61.8% and -78.6% respectively.
Despite the greater losses in actual market cap (because Bitcoin is a larger asset today), individual investors are facing less challenges now than in previous bear market periods.
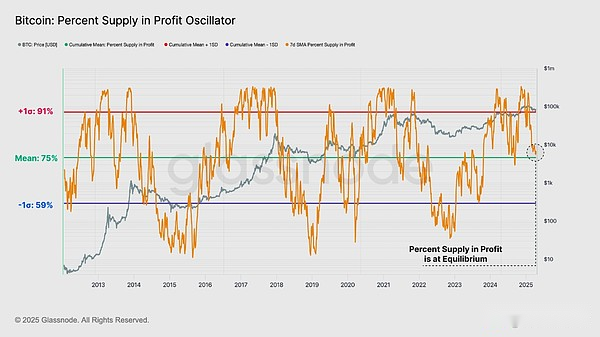
Despite the loss-making realization cap, the percentage of profitable circulating supply remains at a high of 75%.This shows thatMost negative asset investors are new buyers in the top pattern.
Interestingly,The percentage of profit supply is approaching its long-term average.Historically, this is a key area that most currencies need to defend before falling into losses, and it is also a key threshold between bull market and bear market structure.
-
A typical feature of a bull market is that the profit supply is higher than its long-term average and that this level of support is often found throughout the market.
-
Historically, bear markets are often accompanied by depth and duration below the long-term average, and frequent declines at this level confirm a decline in profitability.
Similar to the net realized profit/loss indicator, if it can be held, the rebound in the long-term average range will be a positive observation.
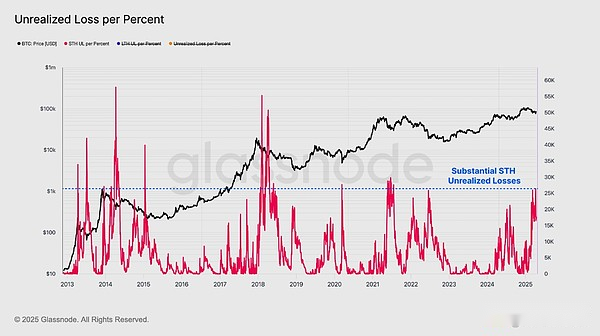
As the market continues to shrink, it is reasonable to expect the absolute scale of unrealized losses to grow.To explain this and standardize retracements of different amplitudes,We introduce a new indicator variable: unrealized losses per percentage retracement, which represents the percentage drop in losses calculated in BTC relative to the all-time high.
Applying this indicator to the short-term holder population shows that after the reduction depth adjustment, their unrealized losses are already considerable, comparable to the level at the beginning of the bear market.
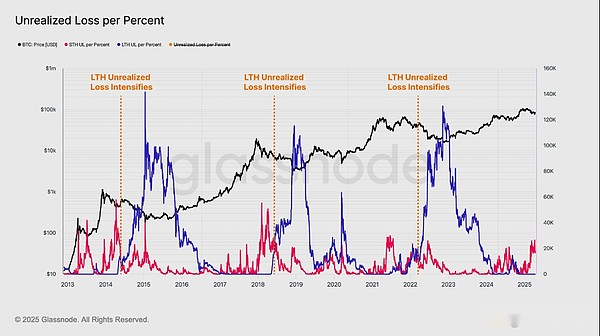
Nevertheless, the current unrealized losses are mainly concentrated on new investors, while long-term holders are still in a state of unilateral profitability.However, an important nuance is emerging, and as WoC 12 points out, the level of unrealized losses in this group may increase as recent top buyers gradually become long-term holders.
Historically, a significant expansion of unrealized losses for long-term holders often marks a confirmation of bear market conditions, although there will be some delays after market peaks.So far, there is no clear evidence that this change is underway.
Summarize
The macroeconomic situation remains uncertain, and global trade trends continue to change, resulting in sharp fluctuations in the US Treasury and stock markets.It is worth noting that Bitcoin and gold’s performance remained strong during this challenging period.One can see this as a fascinating signal, as the foundation of the financial system is entering a period of transformation and change.
Despite its significant resilience, Bitcoin has also failed to protect itself from the dramatic volatility of global markets, its biggest drop in the 2023-2025 cycle.This greatly affects new market participants, who now bear the largest share of market losses.However, from the perspective of individual investors, the market experienced a more severe decline in previous cycles, especially during the bear markets in May 2021 and 2022.Furthermore, mature and long-term investors are not affected by ongoing economic pressure and are in a nearly unilateral profitable position.