
Compiled: Elvin, ChainCatcher
summary
Framework for estimating costs:
-
Step 1: Identify network contributors
-
Step 2: Evaluate the cost components
-
Step 3: Assess the cost structure differences and summarize
Case Study
Key Points
-
To ensure the ongoing participation of nodes in a decentralized physical infrastructure network (DePIN), network managers (founders, DAO members, etc.) must consider the costs incurred by the operator when operating the node.
-
In some cases, key decisions about cost optimization are obvious.For example, Livepeer’s shift from Ethereum to Arbitrum in 2022 is a good choice without controversy and thus reduces settlement costs by more than 95%.In other cases, DePIN managers may need external help to assess the cost of operating nodes when R&D resources are limited.
-
If the node continues to lose money, the operator will stop running the node, resulting in a decrease in overall node supply.Understanding the operating costs of DePIN networks and their main drivers can enable network operators to initiate governance discussions; at the same time, cost estimates can inform R&D work before network service supply begins to decline to reduce costs for node operators.
-
Estimating network operation costs can be difficult for protocol managers because of the anonymity of contributors (those networks are often license-free, meaning anyone can contribute and leave at any time) and the lack of public data related to costs.
-
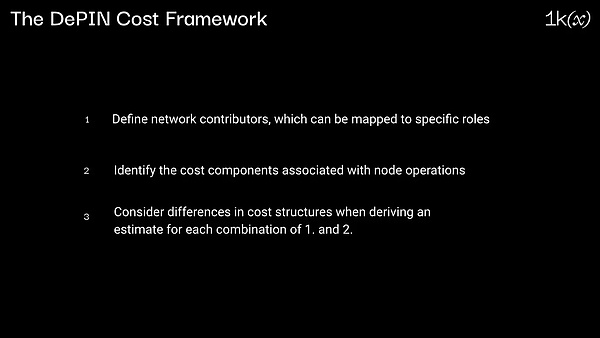
To guide managers’ decision-making, we propose a three-step framework to estimate costs:
-
Define network contributors that can target them to specific roles
-
Identify the cost composition associated with nodes
-
Consider the difference in cost structure when evaluating the combination of 1 and 2
In addition to the overall estimate of current costs, the framework provides:
-
Break down by role and cost components to help identify the largest cost drivers
-
Estimated changes under different assumptions and scenarios for increasing demand/network capacity
Case study demonstrates how the framework is applied.For example, a joint investigation with the POKT network reveals the ongoing efforts of node operators to further expand service nodes.Nevertheless, the residual barriers to economic scalability, including demand generation, are addressed by decentralizing their gateways.
Introduction: What is DePIN and why the cost is discussed
DePIN is a series of decentralized networks that provide hardware resources (physical infrastructure) for a wide range of use cases such as computing, storage, wireless networks, or data measurement.DePINs use the Web3 incentive model (i.e. token reward system) to inspire the construction of physical infrastructure networks.As of May 2024, the total market capital of all DePIN tokens was US$29 billion.
DePINs contribute to both digital and physical resource networks:
In a physical resource network (PRN), contributors deploy location-related hardware to provide (irreplaceable) services.This includes:
-
Wireless networks (e.g. Helium, World Mobile, XNET, Nodle)
-
Sensor networks (e.g. Dimo, Hivemapper, Silencio, Onocoy)
-
Energy networks (e.g. Starpower, PowerLedger, Arkreen)
In Digital Resource Networks (DRNs), contributors guide hardware to provide (alternative) digital resources, and physical location is not the primary standard.This includes:
-
Computation (e.g. ICP, Livepeer*, Akash Network, POKT Network*, Covalent*, Lit protocol*)
-
Storage (e.g. Arweave*, Filecoin, Sia)
-
Bandwidth and privacy (e.g. NYM*, Hopr, Orchid, Mysterium, Fleek)
-
AI (e.g. Bittensor, Fetch.ai, Modulus Labs*)
The early DePIN project generated a lot of initial interest due to its token framework design.For example, Helium rewards contributors HNT tokens to help run wireless networks through hotspots, while Filecoin allows users to rent out their excess storage space.While this is enough to get many DePIN projects started, token issuance may not be enough to ensure long-term participation of nodes in the network.
If the operating node becomes unprofitable, the node operator will no longer have the power to operate the DePIN infrastructure.Therefore, the DePIN founding team must help node operators optimize costs.
DePIN flywheel
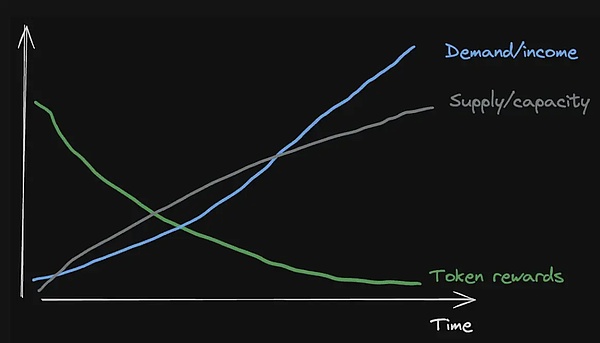
A typical flywheel for DePIN token economy is as follows:
-
Establish a supply side of services, such as storage or 5G antennas
-
Inflationary token rewards incentivize node operators to provide the infrastructure needed, although the demand is not enough to cover costs
-
Over time and demand increases, monetization of network activities may increase revenue for node operators, even if token rewards gradually decrease
-
Continuous monetization of network activities and increasing node operator revenues further incentivize supply, thereby creating DePIN flywheel
The visual presentation of the DePIN flywheel is as follows:
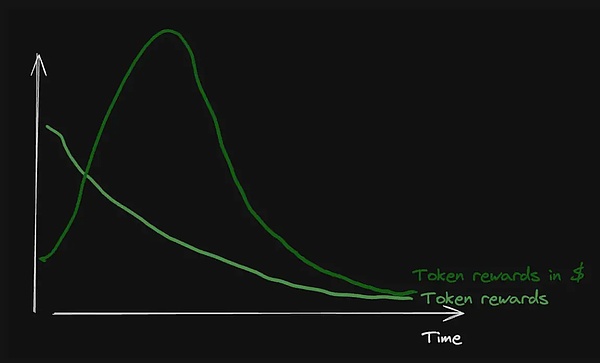
As we described in the reward issuance timeline analysis, the dollar value (token price) of these token rewards is significantly affected by overall market sentiment.So they might look like this:
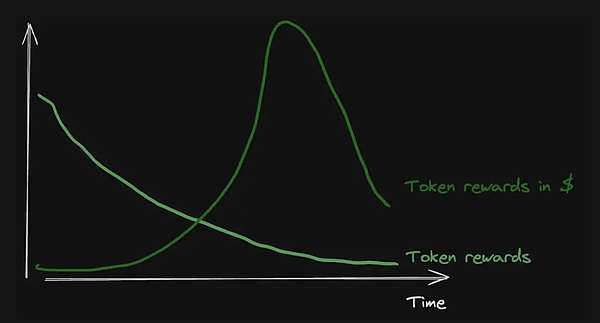
Or depending on the time you enter the bull market, it might look like this:
So, what is the relationship between the issuance of rewards and costs?
As mentioned above, if token rewards and revenue from user demand are not sufficient to break even, the node operator may decide to stop supporting the network.A large portion of DePIN’s operating expenses are paid in fiat currency, which makes the dollar value of the token reward important and pegs to overall market performance.Despite any well-planned token issuance measures, in the worst case, the situation may turn out like this:
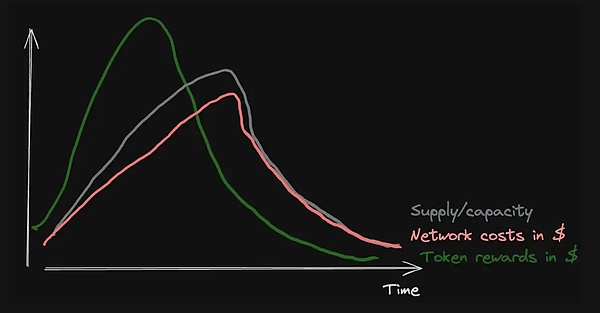
This will lead to the exit of the node operator, which will further translate into higher latency, lower reliability and worse user experience.Eventually, demand stagnation will shut down the flywheel.
The good news is that there are many ways to deal with this situation.One way is to make token issuance more flexible so that it is more consistent with the monetization of the network (see KPI-based issuance here).Another approach is to solve the cost problem to make the overall network more efficient and therefore less sensitive to the decline in token prices.Our dynamic graph will look like this:
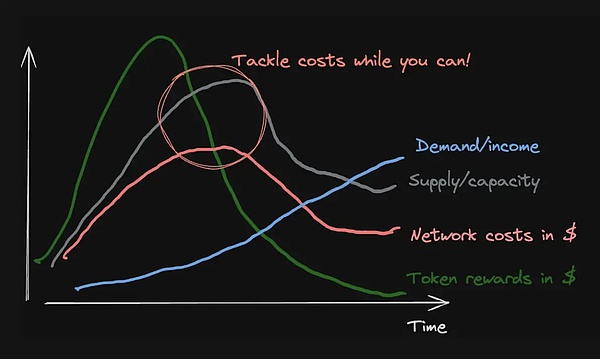
Key Proposition: If you know the cost of operating a DePIN network and its biggest drivers, governance discussions and R&D efforts can be initiated to reduce node operator costs before network service provision is reduced.
Given the decentralized and license-free nature of DePIN, evaluating cost bases is not easy.Although token rewards and user demand revenue are usually tracked on-chain, other costs involved in running nodes are not disclosed (such as infrastructure expenses).This means we need to use assumptions and estimates about available data points.
In this article, we will address this challenge and introduce a framework for estimation.
-
Step 1: Network Contributors
-
Step 2: Cost component
-
Step 3: Evaluate the cost structure of network contributors
frame
We propose the following framework for the administrator of the DePIN network as a methodology for evaluating the operating costs involved in operating infrastructure nodes.
Using this framework, the cost estimate of DePINs is broken down into three steps:
-
Identify network contributors
-
Evaluate cost components (e.g. hardware, labor)
-
Evaluate the above cost structure and summarize it to obtain an overall cost estimate
Step 1: Identify network contributors
Although DePINs provide various services (such as computing, network coverage, mobile data, etc.), the roles required to provide these services are the same (see an overview of DePIN supply-side roles in over 30 networks here):
-
Service nodes/producers: They provide services and their physical infrastructure (such as servers, antennas, dash recorders, etc.).For example, Filecoin’s storage provider, Helium’s hotspot, or Livepeer’s transcoder.
-
Verifier/Observer/Phoneer: They check the work done by the service node, directly or through the accounting layer.The results of these checks are then sent to the accounting layer.For example, Filecoin’s storage providers (as they also verify the storage proof of other providers) and Helium’s Hotspots and Oracle (performing the coverage proof of other hotspots).
-
Computing layer: Tracks the flow and status of the work/services provided and the corresponding payments.Note that the protocol defines the computational logic itself, such as how to track and store work and payments on the blockchain (we will discuss this in detail in another post).For example, Livepeer’s Arbitrum or POKT-chain (operated by POKT verification nodes).
-
Gateways: They are also related to the accounting layer when they are users, service nodes, and when they manage access or aggregate services (such as data in sensor networks).For example, Livepeer’s Orchestrators or Gateways in POKT networks.
-
Certifier: Can participate in the service or observe the economy of the node through mortgage.
Roles related to the demand side (such as sales teams) are not common at present, and evaluating costs associated with running protocols, such as governance costs, is the topic of another article.
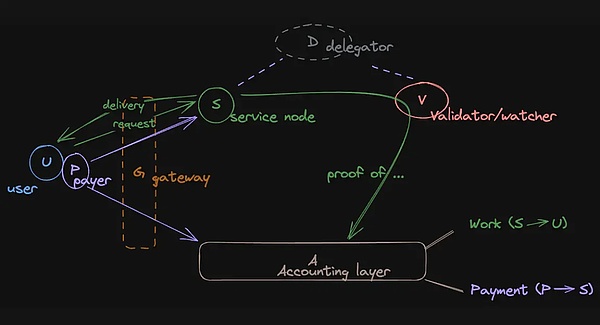
Note that not every DePIN has a delegate and a gateway, and all roles are not required to be separated.For example, Filecoin’s storage provider (SP) is classified as a service node and a validator, and also operates the Filecoin chain, thus forming an accounting layer.The same goes for Arweave miners.
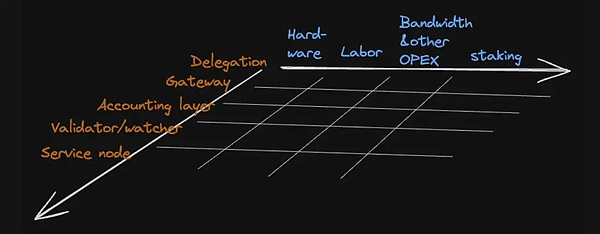
Step 2: Evaluate the cost components
Each of the above roles can be executed through nodes and its cost can be divided into any of the following four components (mostly multiple):
-
Hardware/infrastructure: Costs associated with actual physical infrastructure, such as dash recorders
-
Human: The cost associated with the time spent setting up and operating the infrastructure
-
Bandwidth, electricity, and other operating expenses: Costs related to data exchange and other operating costs, such as electricity, data center rentals
-
Mortgage: No (opportunity) cost of investing elsewhere
The last point is the cost of capital: it is almost impossible to obtain information on the debt/financing costs associated with these operations on a wide range.However, there is a part of what we can evaluate about the cost of capital: many DePINs follow a staking to gain access (working tokens) model and require node operators to stake some tokens to be allowed to contribute.Acquisition of these tokens is an investment, and even if we assume that this amount can be recovered when leaving the network, there is an opportunity cost for holding these tokens compared to investing in capital elsewhere.
Our assessment of the cost component will not be complete if the costs associated with the accounting layer transactions are not involved.Evaluation of this is not simple, it depends on several variables.Generally speaking, the network decides to what extent the accounting is outsourced off-chain.However, there are three options for settlement layer records and on-chain transactions:
-
Proprietary L1: The network runs its own blockchain.For example, Arweave, Filecoin and POKT Network.Typically, service nodes and validator nodes also cover this role, which is why the associated costs are also included (but we will try to separate them if possible – see POKT Network in the example).
-
Proprietary L2, better known as application chains or application-specific Rollup: the costs of Rollup infrastructure (sequencers, etc.) and adjacent infrastructure (block browsers, wallet integrations, etc.) can usually be mapped to these four components.in part.Not very clear situations, such as when using Rollup-as-a-service providers (RaaS), will be mapped to bandwidth and other costs.
-
Public L1/L2: These outsource settlement layers, meaning that the network has no hardware and labor costs.However, service nodes, verification nodes (and users/payers) pay directly (based on usage).There are some challenges in assessing the network-related costs of these transactions, and therefore some limitations: Not all transactions are related to the accounting layer, such as exchanges or other DeFi transactions, but it is not usually easy to separate these transactions.We map these costs to bandwidth and other costs.
Combining all of these elements to create cost estimates is a challenging task.Not only do we need to make an estimate for each cost component of each role in the network, as shown in the figure below, we also need to consider that not all node operators have the same cost structure.Determining the overall cost estimate is more complicated than simply multiplying the number of all network node operators by the estimate of one node operator.
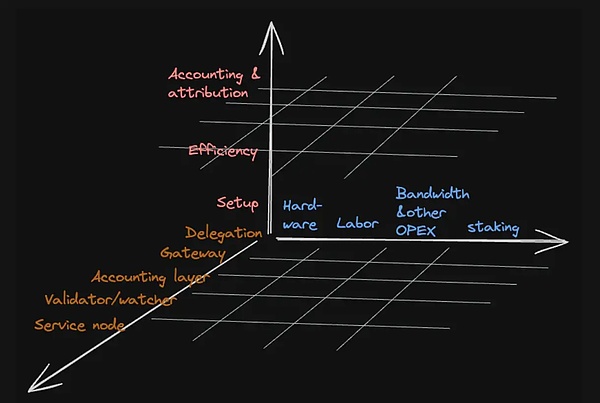
Step 3: Evaluate the cost structure
When we talk about cost structure, we refer to the key differences that affect costs.These key differences make dependency assumptions crucial.Of course, it’s a trade-off: making assumptions simplifies the process, but it can sacrifice accuracy.That is, considering how many factors are involved, certain assumptions must be made to come up with a feasible theory.
There are three main considerations when evaluating cost structures:
-
Differences in setup: A typical example is one operator using a bare metal server and another running on the cloud (buy vs. lease).We can often take these differences into account when we know the corresponding share in the entire network.This also involves the cost of capital in a lease or financing agreement.Assuming there is no cost of capital, we recommend ignoring these differences.
-
Another cost difference is related to the time of purchase (buying storage becomes cheaper over time, buying H100s may not be possible) or the location of operation.We recommend considering the impact of time by using the current price.For labor costs, location is important: DePINs can recruit contributors from around the world, with local wage levels varying greatly, and the time spent on these jobs is difficult to assess.Nevertheless, we made a simplified assumption that in our framework version, all node operators have the same hourly wages.
-
Efficiency Difference: Node operators can have the exact same setup, but if one runs more of the same nodes, they may be less cost per node because of the economies of scale.In our framework, we need to first evaluate the node distribution of each node operator to address these impacts.Then, in order to understand and estimate the cost impact, a survey with larger and smaller operators or other available data points (such as bulk discounts for promotions) is required.
-
Another example is long-time supporters of the network, who progress faster on the learning curve and are therefore more operationally efficient, compared to those who just joined.Unless we have direct data points from the survey, we ignore this aspect.
-
Differences in attribution and computing: Although node operators are equal at the first two points, they may view their contributions on a different cost basis, so the end cost will vary.For example, one person sees their participation as part-time, not tracking any time spent, while another regards it as a primary business, paying wages based on the time spent on the project.We consider this difference by providing a wider range of errors for the “part-timer” side (as they are usually underestimated), but assume that the time investment for each node operation is the same (see also Economies of Scale).
This is related to the benefits of the sharing economy, which is common for DePIN: operators can use the same setup in multiple networks (and therefore also operating expenses such as hardware, labor and bandwidth, power, etc.), such as Livepeer operating with Ethereum and Filecoin,io.net is with Render, Filecoin and other GPU networks.For situations where hardware is critical to operations, we do not consider cost savings associated with the sharing economy.Not only are they difficult to identify, but they are also difficult to quantify which network benefits the most in terms of cost and how to allocate savings.In accounting, we will break down the total cost into monthly amounts.To simplify, we assume that we amortize the total over the entire life cycle with the same duration and allocate the same amount for each month for all node operators.
Of course, there are more nuances, which we will explore in the DePIN repository for a longer time.
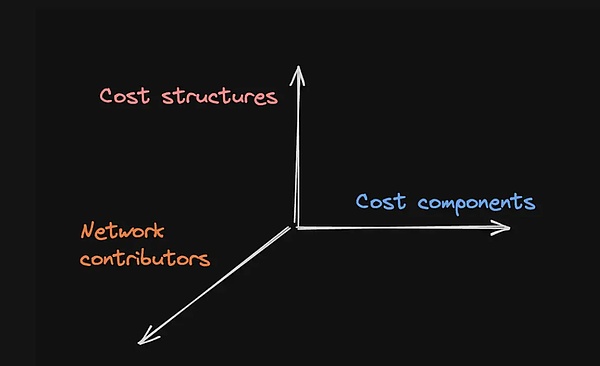
This adds a third dimension to our “execution plan”, creating 60 different combinations to consider:
Overall, while this formula is very comprehensive and gives multiple cost structure options, it is most useful to apply it to multiple different time points rather than one static time point.The most powerful model is the one that links operational costs to network capacity.This allows us to understand how much cost varies with capacity or utilization.The capacity of the network is related to the services provided by the network, such as the number of RPC requests for the Pocket, the amount of storage for Arweave or Filecoin, or the percentage of road network mapping for Hivemapper.
Please note that this formula requires a lot of publicly available information, which we recommend to obtain through the documentation provided by the network, forums/Discord posts and, if possible, through investigations.
Conclusion and next steps
As DePINs evolve at an increasing rate, estimating the cost components of various DePINs is challenging.In addition to known power laws regarding hardware costs and capacity over time, estimating cryptocurrency-specific costs, such as the gas and throughput capabilities of the settlement layer, is not an easy task.
Knowing the relationship between current costs and reward issuance and demand-side revenue, how the biggest cost drivers change with assumptions, and how costs increase with demand are all useful indicators.
To help guide governance decisions about DePIN economic design, cost estimates need to be associated with reward issuance and use revenue.While I plan to provide more examples of DePINs cost estimation, I welcome feedback on the proposed framework, its assumptions and summary, and potential improvements to the provided cost estimation.
Appendix – Example framework
Livepeer
Livepeer provides a decentralized video infrastructure for live and on-demand streaming.Recently, Livepeer began enabling idle GPU resources for AI model training use cases (see here for details).
Here is a process of step-by-step application of the framework.Most cost estimates are based on surveys and community information conducted with node operators (i.e. Orchestrators) in the summer of 2023 (e.g. here).
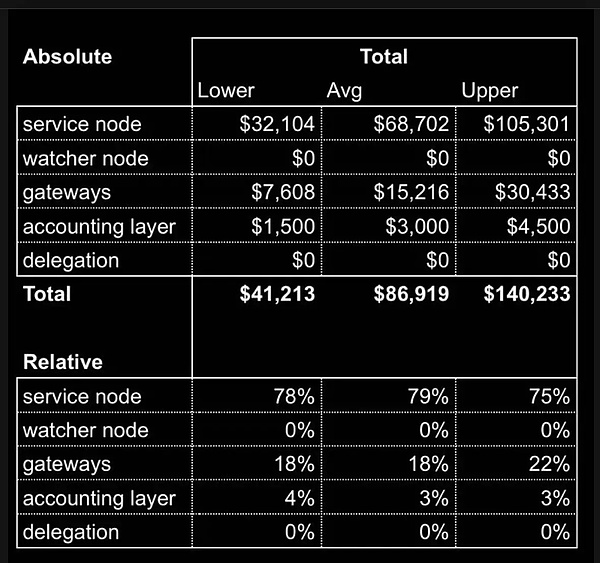
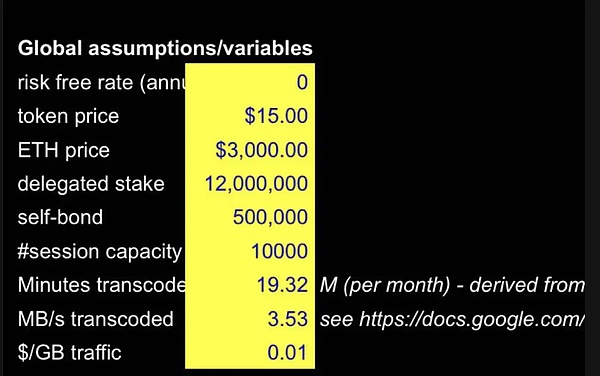
The total estimated cost of operating a Livepeer network is approximately $85,000 per month.A detailed breakdown of average costs shows that hardware and labor account for about the same share (about 40%).Taking into account the uncertainty of the labor cost estimates described in the table, the monthly cost of the 100 Orchestrators of the network, their transcoders and settlement costs on Arbitrum is approximately $40,000, which is at the lower end of the estimate range.It is worth noting that the cost of $40,000 per month is not far from the current fee income of about 5-10 ETHs per month (corresponding to the ETH price of $3,000-4,000).However, Orchestrators have no negative profits because a larger portion of their revenue actually comes from pledge rewards.
It is worth noting that because Livepeer’s transactions are settled on Arbitrum, the cost of the settlement layer is in the range of 0.5-2 ETH per month.This saves more than 95% of the cost compared to what happened before the Arbitrum migration in the first quarter of 2022.Additionally, transactions on Livepeer have increased by 2-3 times as of today.Relatively speaking, the accounting layer now accounts for about 5% of the total cost, while pre-migration (about 80% of the total cost) is a major cost driver.
Recently, it has adjusted the algorithm to determine how to distribute work, focusing more on the price per pixel provided by Orchestrator.This puts downward pressure on transcoding prices and may help promote demand, but discussions in the forums show that price levels need to be lowered further.On the other hand, the recent launch of AI-subnets may help add further monetization paths to the network.
One potential scenario in the estimation spreadsheet is that a 3x increase in the demand for transcoding minutes will only increase the overall cost by 20%.It is worth noting that bandwidth is the main driver of cost increase.
If we assume similar price levels ($3,000 in 1ETH), this should be enough to get the network into the breakeven zone.However, if the transcoding price drops by 50%, the network-level expense revenue will be approximately $45,000 per month, thus below the lower limit of cost estimates.With new use cases such as AI video generation (and thus increasing monetization opportunities), it remains to be seen how the cost and revenue dynamics on the Livepeer network will change.
POKT
At its core, the POKT network provides decentralized remote procedure call (RPC) endpoints.Recently, POKT Network announced that it will expand to more use cases about AI model reasoning.The framework for step-by-step application is as follows.Most cost estimates are based on surveys with node operators in the summer of 2023 and follow-up interviews with those node operators and gateway operators.
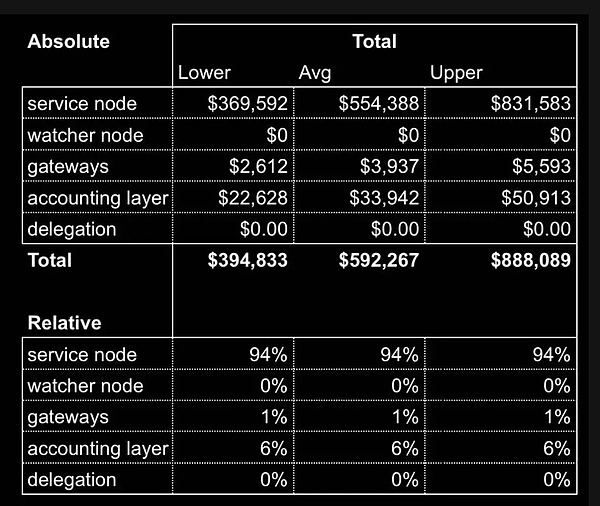
Based on approximately 15,000 nodes and four gateway operators that provide RPC endpoints, we estimate that the POKT network currently costs approximately $200,000 (+/- $80,000) per month to serve approximately 500 million relays per day.The largest part at present is the service nodes (about 75% of the cost).
Since we can get historical data on the number of active nodes in the network and data points with different cost components over time, we can put the network cost estimate on a timeline showing three larger costsCut the time points to be resolved:
-
Node integration after entering the mid-2022 bear market and reducing token rewards (especially USD-based token rewards)
-
Network-wide introduction of improvements such as Geomesh and LeanPOKT significantly reduce operating costs, as well as personal improvements to the setup by node operators
-
Decentralized gateway role reduces bandwidth costs by adding simpler gateway settings
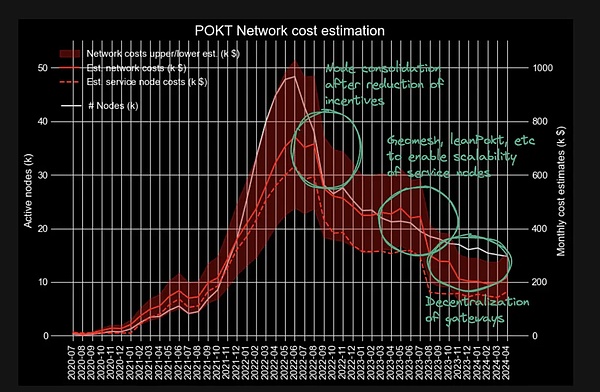
Since our cost framework links cost estimates to network capacity and requirements, we can evaluate changes in cost structure.For example, if demand increases from the current 500 million per day to, for example, 2.5 billion relays per day, the gateways will account for 60% of the total cost base, about $400,000 per month (currently about $200,000).Note that this is 2 times the cost, while demand increases by 5 times.This is because the service nodes can improve their setup and therefore can meet growing demands on a substantially same cost basis.
If we further assume that the share of new gateways operating on a lower cost basis in the total number of relays for services increases to, for example, 50% (currently 30%), the overall network cost will be $300,000 per month.
As gateways become decentralized, gateway operators can define their price points individually.If we assume the average price per million request is $4, the overall scenario of the POKT network will earn $300,000 per month, thus basically break-even.
Dfinity/ICP
Dfinity/Internet Computer Protocol (ICP) is designed as “blockchain for blockchain” to provide computing resources for the execution of smart contracts (called canisters) that are organized in a subnet (details https://internetcomputer.org/whitepaper.pdf).The pillar is a node machine that provides storage, computing, and bandwidth to replicate all canisters, states, and its subnet computing.
The framework for step-by-step application is shown here.Most cost estimates are based on data in documentation and forum posts.
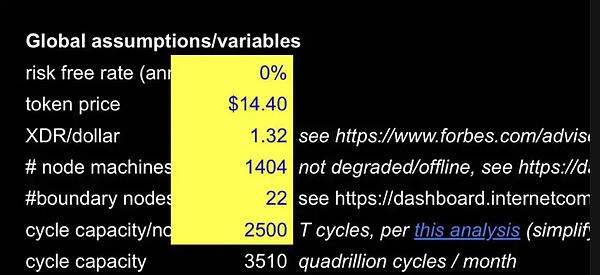
ICP is one of the few networks that incorporate fiat currency-based costs into token reward mechanisms, which makes cost assessment easier.Currently, approximately 1400 node machines are run by approximately 85 operators.For economies of scale for larger operators, we have no data points, so our overall estimates are quite broad: the cost of operating an ICP network is about $400,000 to $900,000 per month, and an average of about $600,000.
While an appropriate income assessment is worth a separate article, we estimate that current monthly income is about $25,000.This seems low compared to the estimated cost, but this is due to low utilization: With only 559 node machines active, we estimate that the current demand (expressed in cycle burn rate) is about 2% of the total capacity.This means that the network can withstand, for example, a 25-fold increase in demand, and still does not increase the current cost base.A forum post actually estimates that demand will reach 15-25 times over the next two years, and then (when otherwise equal) will result in ICP earning these fees per month.
DIMO
DIMO is a decentralized network that empowers drivers to manage their vehicle data.Meanwhile, DIMO enables businesses and developers to build innovative mobility-related applications (and then monetize them).Data measurement is performed through special devices (Autopi, Macaron) or applications.Although the above DePIN example is a digital resource network, DIMO is the first example of the physical resource network included in this analysis.
The framework for step-by-step application is shown below.Most cost estimates are based on online (device) price information, Dune data, and forum posts.
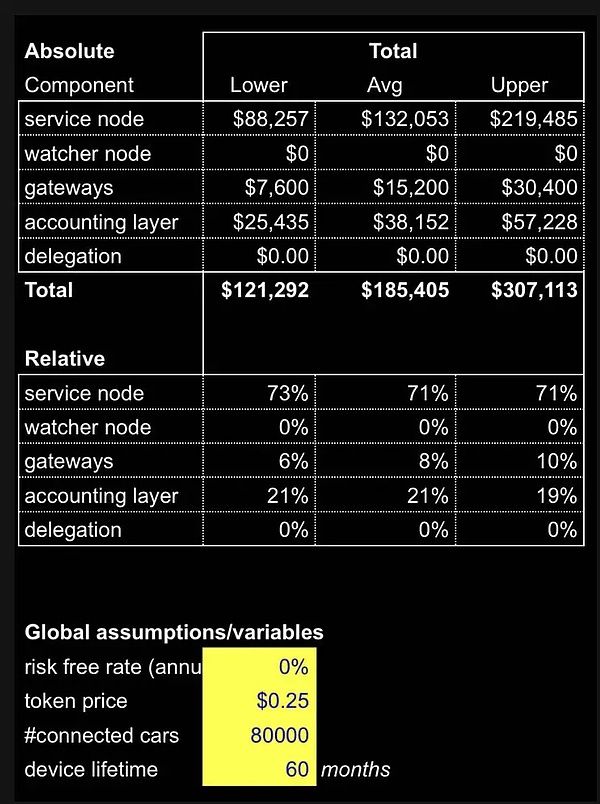
For the settlement layer, we assume that half of the $0.6 to $1.5 per connected car spent on Q1 2024 can be attributed to DIMO’s operations.For gateways, we assume that the monthly hardware cost is about $4,000 and the labor cost associated with the above operations is about $11,000 per month.Overall, this adds up to about $180,000 per month expenditure, as shown in the table below.Most of the costs are related to bandwidth and other costs, with about 1/3 of which are related to settlement costs on Polygon and the other 2/3 are related to monthly cost share of smart car integration.
We have no clues about actual revenues in the network, but by using estimates of global automotive data markets and related automotive data revenues, it shows that current revenue per car is about $150 to $185, which may grow to $500 to $600 by 2030.If DIMO can earn 10-15% of its revenue from it, the revenue generated will range from $110,000 to $180,000 per month, covering operating costs.
However, data monetization itself does not seem to be an actual protocol goal; instead, DIMO focuses on providing infrastructure to build applications on top of the network (https://docs.dimo.zone/overview), which is reflected in the latest DIMO nodes andToken upgrades are being discussed.Changes in the discussion may affect the above cost structure.
Special thanks to my contributors: Mihai (Messari), Raullen (IoTeX), Nodies Team, Grove Team, Pocket Network Foundation, DIMO Team, Diana Biggs and Christopher Heymann for their contributions to feedback and comments.
*The standard project is a 1kx portfolio.