Author: Steven Ehrlich Source: unchainedcrypto Translation: Shan Oppa, Bitchain Vision
It’s no secret that Ethereum has not had a good time this year.It lost its momentum in the face of multiple key competitors, community demands change, the Ethereum Foundation has undergone major personnel adjustments, and the roadmap has been completely rewritten.The question remains about how it gains a foothold in competition with other first-layer public chains and even the second-layer networks it has spawned itself.
But despite this, it finally ushered in a clear bullish wave, which has outperformed its competitors in recent years.
I also talked with some market experts, who told me that the Ethereum market is not over yet.
Ethereum breaks through the $3,000 mark and is expected to continue to rise

When Bitcoin (BTC) entered a consolidation period after a sharp rise last week (breaking over $120,000 for the first time and hitting a new high of $123,000), Ethereum, the second largest cryptocurrency in the world’s market capitalization, seemed ready to unlock a new round of gains.
In addition to being boosted by Bitcoin’s rise and positive trends in the U.S. Congress in terms of stablecoins and broader market regulation bills, Ethereum has also benefited from a group of crypto companies using it as a “crypto treasury” asset.For example, Sharplink (SBET) and Bitmine (BMNR) accumulate ETH worth $866.8 million and $503.8 million, respectively.In addition, this trend of “crypto-treasury companies” has just begun, and there will be more followers in the future.
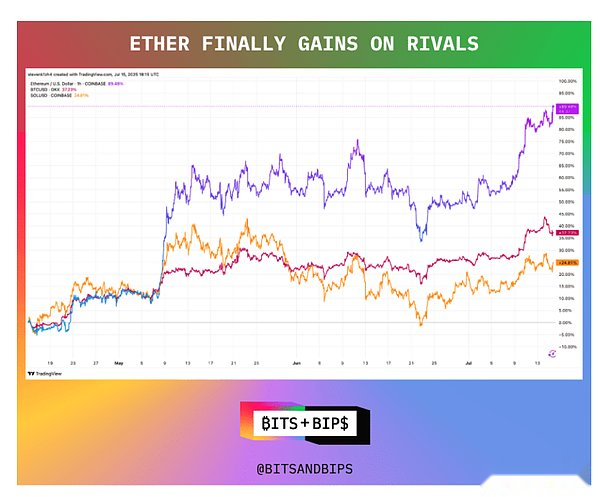
At the current price of ETH is around $3088, it is rapidly recovering the gap with major assets such as Bitcoin and Solana (SOL).Ethereum has risen by nearly 90% over the past three months, far exceeding the performance of other major crypto assets.
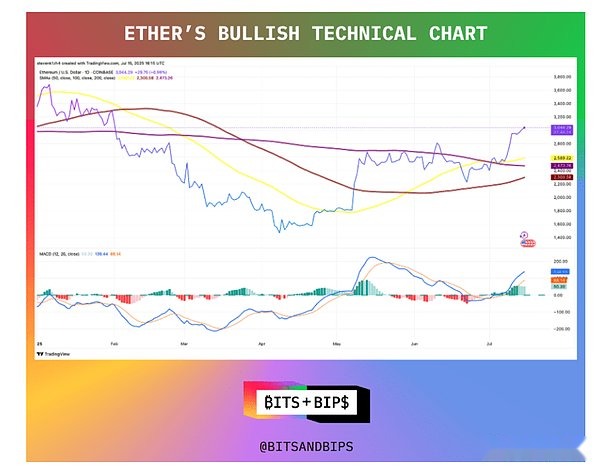
Several bullish signals appeared on the ETH price chart, including the so-called “golden cross” – the 50-day simple moving average (SMA) crossing the 200-day moving average.In addition, the MACD (Exponential Smooth Moving Average Line) indicator is also flipped to a positive value, which is a common tool for measuring short-term momentum in technical analysis.
As can be seen in the chart, ETH showed a golden cross at the end of June, while the MACD indicator was corrected.When the MACD line (the difference between the 12-day and 26-day EMA) passes through the signal line (9-day EMA), it is usually regarded as a signal of a short-term trend turning long.EMA is similar to SMA, but gives higher weight to recent prices.
In addition, ETH also successfully broke through key resistance levels – its 200-day SMA, a level that has been tested several times since early May.Previously, it had crossed the 100-day moving average in May.
There is still room for growth
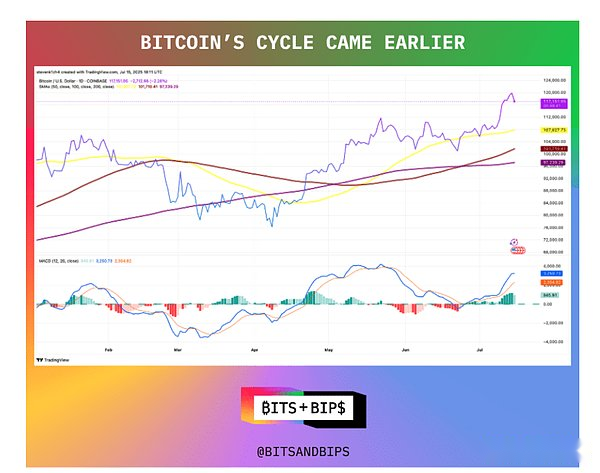
From a technical perspective, Ethereum seems to be in an earlier stage of the Bitcoin bull cycle.First, its MACD upwiring is done below the zero axis—that is, the 12-day and 26-day EMA levels are equal.Such upward crossing is often seen as an early signal of a shift from a bear trend to a long cycle, and some analysts believe it is a good buying opportunity.
This view is also supported by Bitcoin comparison charts.Bitcoin’s MACD up-wrapping occurs earlier and is completed near the zero axis, indicating that its upward cycle starts earlier and does not experience the obvious negative sentiment and price pressure that Ethereum has previously.Bitcoin’s golden cross appeared in mid-May and broke through the 200-day SMA in April, showing its market lead.
Traders’ expectations for future ETH price trends have also diverged from Bitcoin.A useful measure is “Implicit Volatility,” which infers market expectations of future volatility by analyzing the pricing of 30-day options.
In traditional finance, the most famous tool is the VIX (Chicago Options Exchange Volatility Index), known as the “panic index” and is often negatively correlated with the S&P 500 (SPY).That is, the rise in VIX is often seen as a signal of market panic.
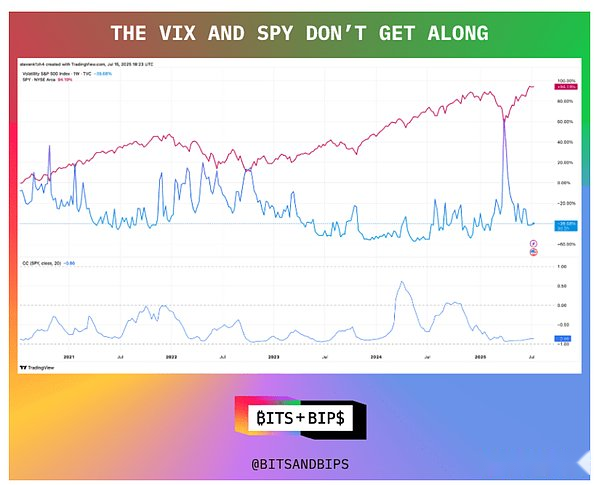
However, in the crypto market, this relationship is slightly different.Cole Kennelly, founder and CEO of Volmex, said that the “panic index” in the crypto market is also negatively correlated during the period of market fear, but it will show positively correlated during the period of market “greed”, that is, spot prices and implicit volatility will rise simultaneously.
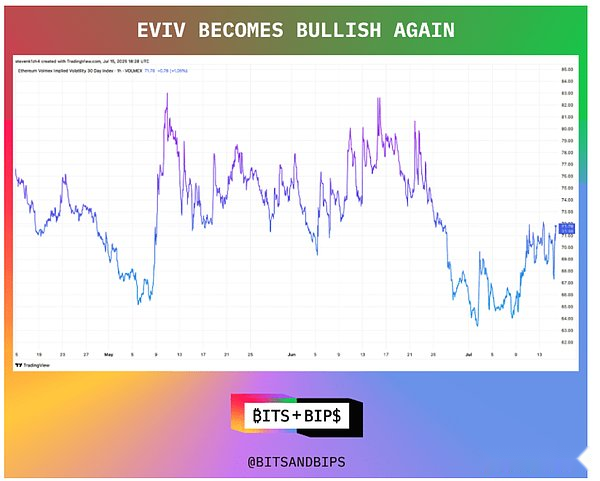
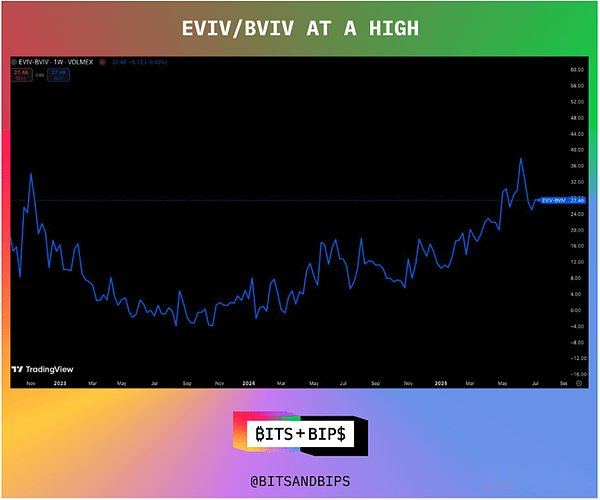
For ETH, several interesting phenomena are happening.First, the Ethereum Volatility Index (EVIV) began to rebound again after a brief decline at the end of June.More importantly, its volatility level relative to Bitcoin is also rising, reaching its highest level since 2022.This usually means that the market’s bullish sentiment towards ETH is increasing, and subsequent momentum is expected to continue.
How high is there any space?
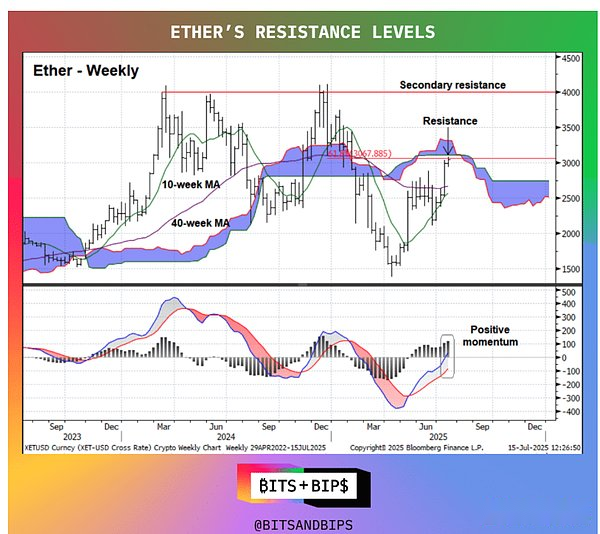
Will Tamplin, senior technical analyst at Fairlead Strategies, said ETH’s next resistance is around $3,100.Therefore, despite the bullish technical signals mentioned above, ETH may consolidate briefly here.
Ethereum is now in the overbought zone, but there is no real sell signal yet.It can be said that this is another ‘touchstone’ stage.I wouldn’t be surprised to see it briefly digest the recent gains, but judging from all the evidence mentioned earlier, it will eventually break through and continue the trend.Once it breaks through $3,100, the next key target will be $4,000 – a price that Ethereum has not touched since January.