
Source: On-Chain Mind, compiled by: Shaw bitchain vision
I am increasingly convinced of a point of view:Bitcoin price will never fall below $50,000 again.
In the field of Bitcoin analytics, predicting the next fanatic peak always takes the headlines.But few people pause to think about a more practical — and arguably more useful — question: What will happen to the worst from now on?
In this article, I will explore 5 different perspectives—covering technology, probability and on-chain—all pointing to a stunning conclusion: Bitcoin is extremely unlikely to fall below $50,000 again.
This is a bold assertion, and I’m happy to be wrong.But when the data is so persuasive, it’s hard for me to ignore it.
Let’s get started.
Overview of key points
-
Technical Benchmarks: Long-term moving average and logarithmic models provide rising support for Bitcoin’s price movement.
-
Probability and on-chain insights: Statistical bias and holder behavior have been identified in the past for reliable bear market bottoms.
-
Cycle dynamics: Analyzing the largest retracement and peak forecasts in history can predict the worst situation in the future bear market.
-
Long-term perspective: Continuous adoption and depreciation of fiat currency ensure that Bitcoin’s growth trajectory remains on the rise for a long enough time span.
200-week moving average: a tried and tested basis
Few indicators are as highly respected as the 200-week moving average (200W MA) when determining reliable support levels for risk assets.
-
It represents the average closing price over the past 200 weeks (nearly 4 years).
-
In the stock market, it has long been seen as the last line of defense, indicating that deep adjustments tend to bottom out here.
-
For Bitcoin, despite its short trading history, it also plays the same role.
Visual Chart: The 200-week moving average (MA) presents a smooth, upward slanting curve below the price movement of Bitcoin.
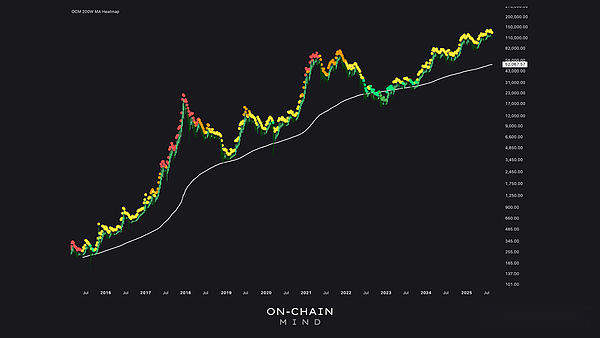
The white line represents the 200W moving average.This diagram helps to visually show how much the price extends relative to this baseline.
Since 2016, every important Bitcoin bear market has found support near this line.The bear market in 2022 briefly fell below the 200-week moving average due to the impact of FTX collapse and rising interest rates.However, the rebound was fast and the price of Bitcoin rebounded rapidly.
Currently, this average hovers around $52,000 and is continuing to climb steadily, affected by the compound effects of adoption and price increases.Looking ahead, given the current price and uptrend, it is unlikely that the price will fall below $50,000 even if there is a brief decline in the next cycle.
Logarithmic growth zone: Drawing the maturity trajectory of Bitcoin
Bitcoin’s volatility makes traditional linear charts almost useless for a long-term perspective.The use of logarithmic scales of the price can compress violent fluctuations, allowing us to observe the asset’s maturity process over each cycle.If you’ve ever looked at the price chart of Bitcoin, I’m almost certain that you’re seeing a logarithmic chart.
One of my preferred tools for evaluating Bitcoin’s long-term growth trend is the “logarithmic growth band”, which consists of a central trend line, as well as a resistance band above it and a support band below it.These indicators are derived from regression models, with adjustable parameters including slope (growth rate) and attenuation (volatility gradually decreases as assets mature).
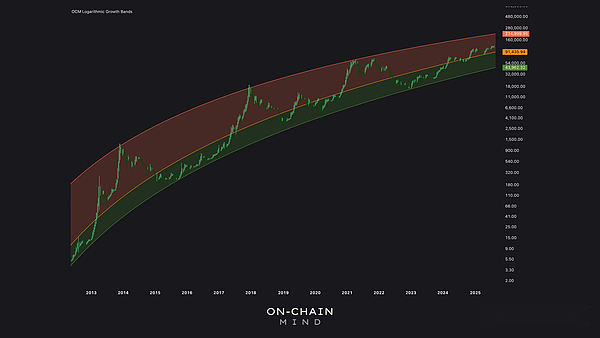
Center growth line: $91,000.Cap: $214,000.Lowest limit: $44,000.
Currently, the central trend lines in these ranges are located around approximately $91,000 and this trend continues to rise regardless of the market’s cycle.More importantly, the lower limit “support” today is about $44,000.At the current rate of growth, this support will rise above $50,000 in about 4 months and is likely to not fall back from now on.
There are two forces supporting this model:
-
Adoption rate continues to rise: the user base, corporate treasury and institutional investment portfolio are all expanding.
-
Currency depreciation continues: inflation and currency expansion have boosted the nominal value of scarce assets such as Bitcoin.
These structural drivers work together to mean that even Bitcoin’s “worst-case scenario” will be on the rise.And over time, although these ranges may narrow slightly due to market maturity, the bottom will continue to rise unstoppably.
But this is not a wishful thinking—it is a conclusion based on regression analysis.Without delving into complex mathematical principles, the key is that although Bitcoin’s astonishing triple-digit returns are naturally slowing down each year, the model still shows that its sustainable growth rate is between 20% and 50%.
Z-score probability wave: focus on statistical extreme values
Technical analysis often seems descriptive, but there are statistical methods to evaluate how Bitcoin prices move relative to their history.One of the most effective tools is the Z-fraction probability wave model.
It essentially provides a statistical indicator to measure the extremes of Bitcoin’s price relative to its historical normal.The Z score is calculated from the mean in units of standard deviation: A Z score of -2 means that the price is lower than the mean two standard deviations, which is a rare event in a normal distribution with a probability of about 2.3%.
In the past cycle, bear market lows usually correspond to the -2 standard deviation, and occasionally touched the -3 standard deviation at extreme panic moments (such as the 2022 FTX crash).
-
Now, the -2 deviation value is close$64,000.
-
More extreme -3 deviation value hovers inAbout $45,000.
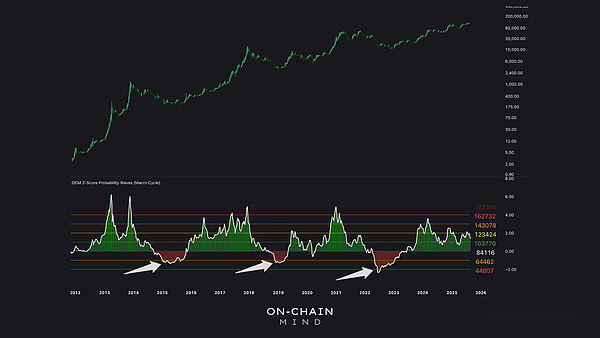
Like other indicators, these values will rise over time, reflecting the structural growth of assets.It is worth noting that even if Bitcoin plunges to an extreme statistical low tomorrow, it may still gain support around $50,000 or above.
The convergence of these independent models reinforces the idea that Bitcoin’s “new normal” has moved upward.
On-chain data: The wisdom of long-term holders
As an asset, one of the unique advantages of Bitcoin is that we can see the time and price of Bitcoin being transferred for the last time through on-chain data.This transparency makes it possible for complex indicators such as long-term holders (LTH) to achieve price.
-
“Long-term holder” is defined asWallets that have not spent their tokens at least 155 days (about 5 months).
-
Historically, this group represents “smart money” – patient investors who absorb funds when the market is weak and sell when the market is strong.
-
LTH realization price is the average cost basis for these holders.
In each previous cycle, LTH realized prices served as a solid bottom.When market prices briefly fall below this price, those moments mark an excellent long-term buying opportunity.
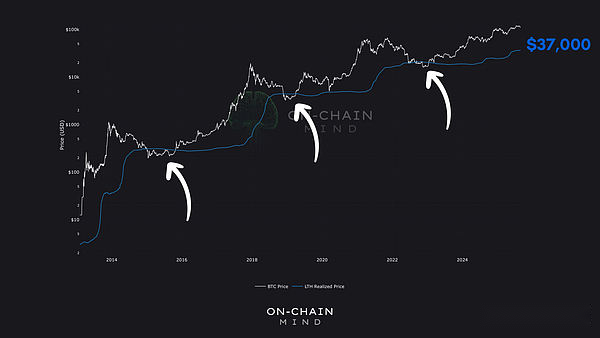
Currently, the realization price of LTH is about $37,000, which has doubled in the past year.In the previous cycle, this figure rose 5 to 10 times from its starting level in the late stages of the bull market.Even if the cycle is more modest, this trend suggests that the realization price of LTH will soon climb above $50,000 and stay at this level.
This makes sense intuitively: as long-term holders set the cost base higher and higher, the possibility of prices falling below this cost base for a long time becomes smaller and smaller.
Cycle Peaks and Retracements: Predicting Worst Situation
To test our current argument, let’s try to consider the possible position at the top of the cycle and then predict the worst case from there.
One of my comprehensive metrics is called the “cycle top line” and it integrates 6 different on-chain metrics that have historically marked Bitcoin’s fanatical peaks.While no model is perfect, their combined averages suggest that the top of this cycle could be around $211,000.
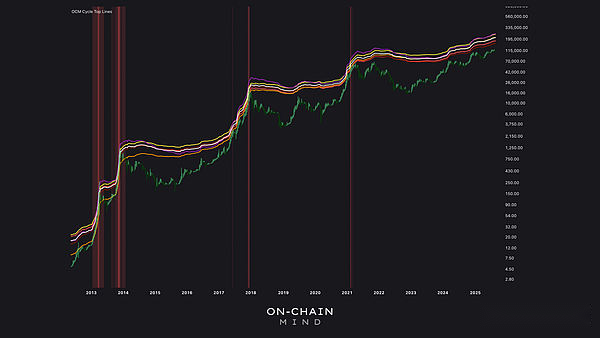
The consolidated average for these 6 indicators is currently about $211,000.
Now, the important part is:What will happen next?
-
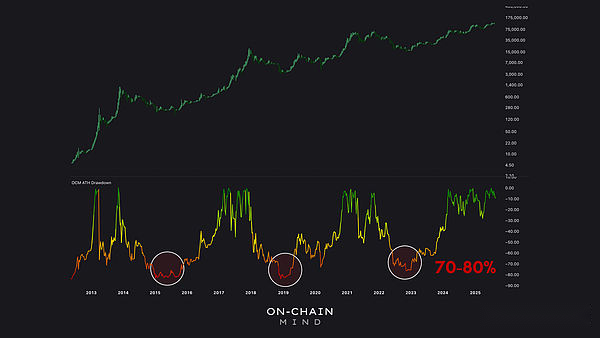
Historically, in every previous bear market, Bitcoin would pull back from its historical highs70%-80%.
-
Even if the intervention of institutional investors can alleviate the severity of future market pullbacks, it would be too complacent if this rule is completely ignored.
therefore,If the price of Bitcoin reaches a peak of $211,000 and then falls 75% , the implicit bottom price is about $52,000.This is very close to the predictions of other models we have reviewed.
However, due to the rise of Bitcoin ETFs and the increasing number of companies holding Bitcoin, many claim “this time is different”, but before this cyclical behavior is completely broken, we must assume it will reappear in a similar way.
No matter what position you take, the message is clear: even in a severe bear market, structural support indicates that Bitcoin will not fall below $50,000 again.And the longer the bull market lasts, the higher the bottom will rise, and it may rise to the range of $70,000 to $80,000.
This redefines my point of view: a portfolio shrink of 75% sounds bad, but it’s still at a fairly high level when it comes to higher peaks.
Why is the bottom easier to predict than the top
One paradox of Bitcoin analysis is that the bottom is easier to predict than the top.
-
The formation of market tops is driven by unpredictable factors: fear of missing out (FOMO), news cycles, liquidity shocks, and excessive speculation.
-
However, the support level is determined by structural reality: long-term holders’ operating behavior, key moving averages, statistical baselines, and adoption curves.
That’s why it seems to me that estimating the bottom of Bitcoin is often more realistic than guessing where the top is.
Nowadays, it is not difficult to see that $50,000 is not just an integer, it represents the intersection of multiple independent signals, all pointing to the same information:Bitcoin’s structural bottom is moving upward forever.
So while the hustle and bustle of the market always tempts us to over-focus on the next price fluctuation, the more important fact is that Bitcoin prices below $50,000 are likely to be history, not future.


