Author: Digital Asset Research Source: substack Translation: Shan Oppa, Bitchain Vision
If there is one sentence that sums up what we are doing here, it is: separate the signal from the noise.This is a common phrase in investment, but what does it mean?It just means that when it comes to what’s going on in the market, there’s a lot of noise.Your job is to filter it and find the information that really matters.
In other words, you have macro experts, economic data, interest rates and a million other data points that can create an unlimited number of scenarios for you to consider.All you need to do is find the real signal that tells you what the market is going to do.
In other words, you have macro experts, economic data, interest rates and millions of other data points that create an infinite number of scenarios for you to consider.One thing you need to do is find the actual signal that tells you how the market will work.
This is exactly what we are going to do.
By focusing strictly on time and price as our signal, we can ignore nonsense that 99% of others think is important.I’m sorry to tell you that the number of jobs, interest rates, and even who we choose to be president doesn’t matter.There is nothing to stop the market from being overwhelmingly powerful.
When the bull market begins, it is like a volcano, tsunami or an avalanche, a supernatural force.No obstacle can stop it from completing.It will run through everything on the road until the energy dissipates and time ends.The same is true for bear markets.No amount of stimulus or government intervention can stop it from completing.
We have been using these powerful time and price signals to eliminate noise and deliver unparalleled results to subscribers over the past two years.Three months ago, we issued an emergency warning to readers that August will be your last chance to buy cryptocurrencies before the major bull market wave begins.
This has proven to be very accurate in the past four weeks.Today, as August is coming to an end, we give you a final warning.The expansion phase of the cryptocurrency market will begin in the next 5-7 months, and almost everyone underestimates this.I’m writing a special report that will be sent to a premium subscriber detailing what I’m seeing.
We are one of the first and only research companies to predict that Bitcoin prices will hit record highs before the halving.Now, market participants are all looking at the 100,000 mark in a similar way.However, what I’m seeing is a stronger growth.I will keep details for subscribers, but in short, if history is available as a reference, I believe we will break the 100,000 mark in the next five months and expand at a faster rate than most people would expect.
Now you may have seen that I am very optimistic about the future of this market.Let me show you a few simple charts that give you all the “signals” we need.Everything else, interest rate cuts, elections, economic data are just noise.
Bitcoin
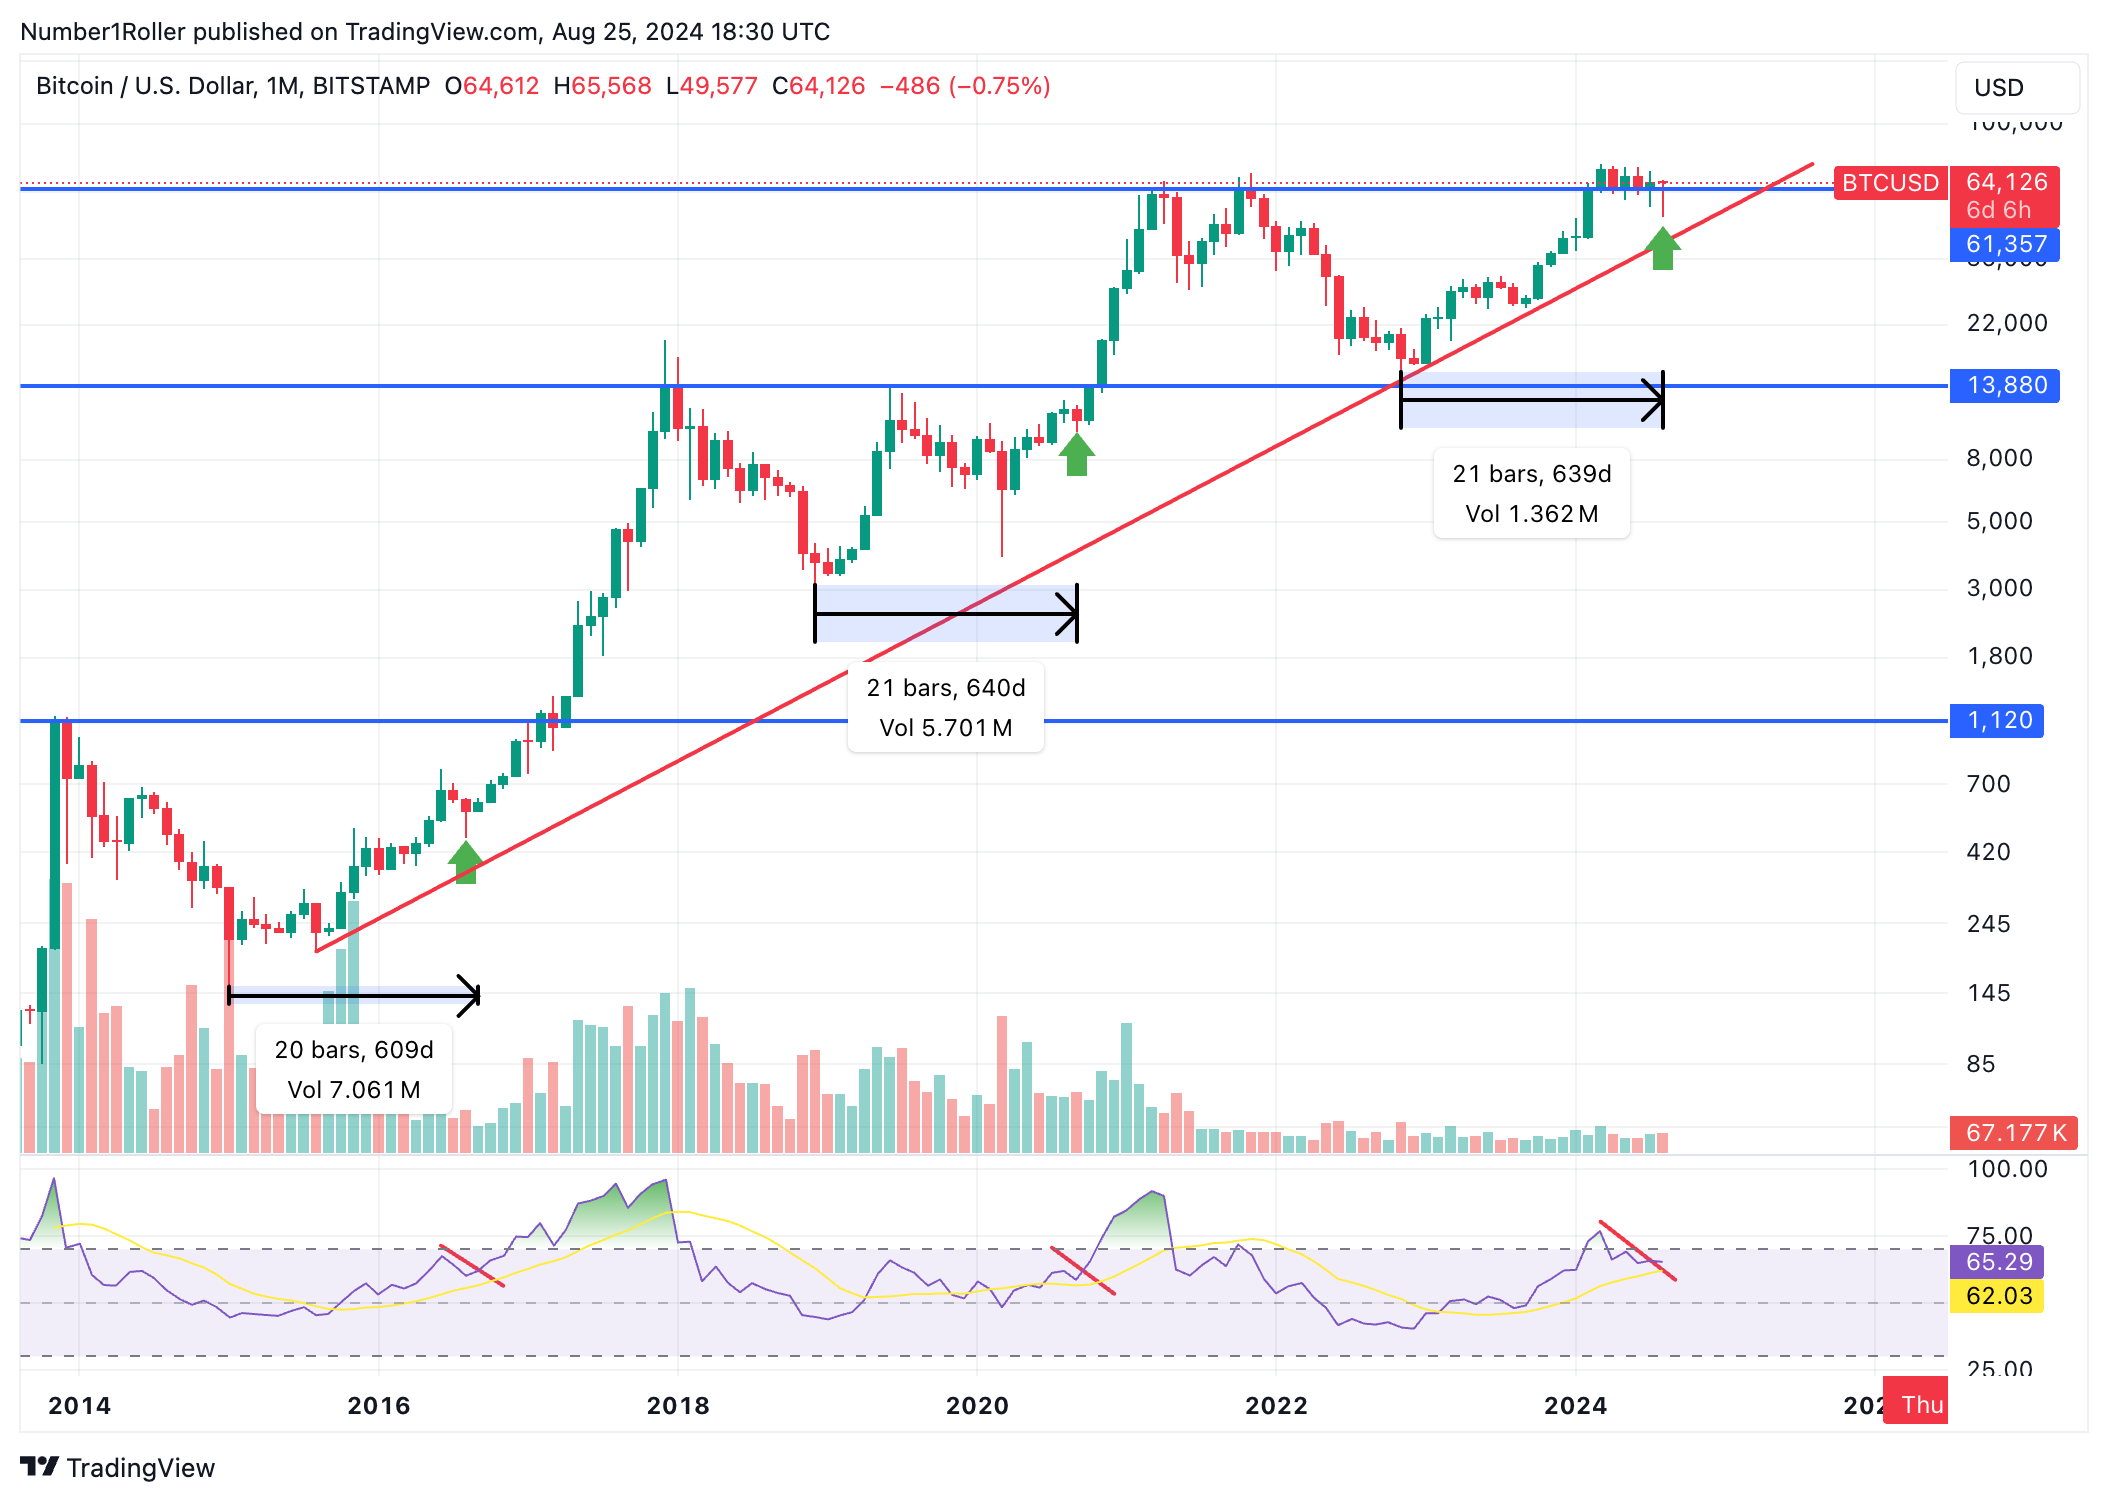
Above is a simple monthly chart of BTC.As you can see, it keeps repeating the same rising triangle pattern.Consolidation below previous all-time highs (or in this case above) usually ends at a position about 21 months from the low.They are usually done around the August-September window marked by green arrows.All the months marked by green arrows are characterized by the swallowing of this large bottom wick.Finally, look at RSI.The same pattern is repeated there too.
This is the only chart you are as bullish as I do.In fact, if we close today, this latest monthly candlestick chart will be one of the most bullish monthly signal candlestick charts in Bitcoin history.We are talking about looking for “signals” and it’s interesting that this month’s candlestick chart is exactly what Gann calls it.
BTC.D
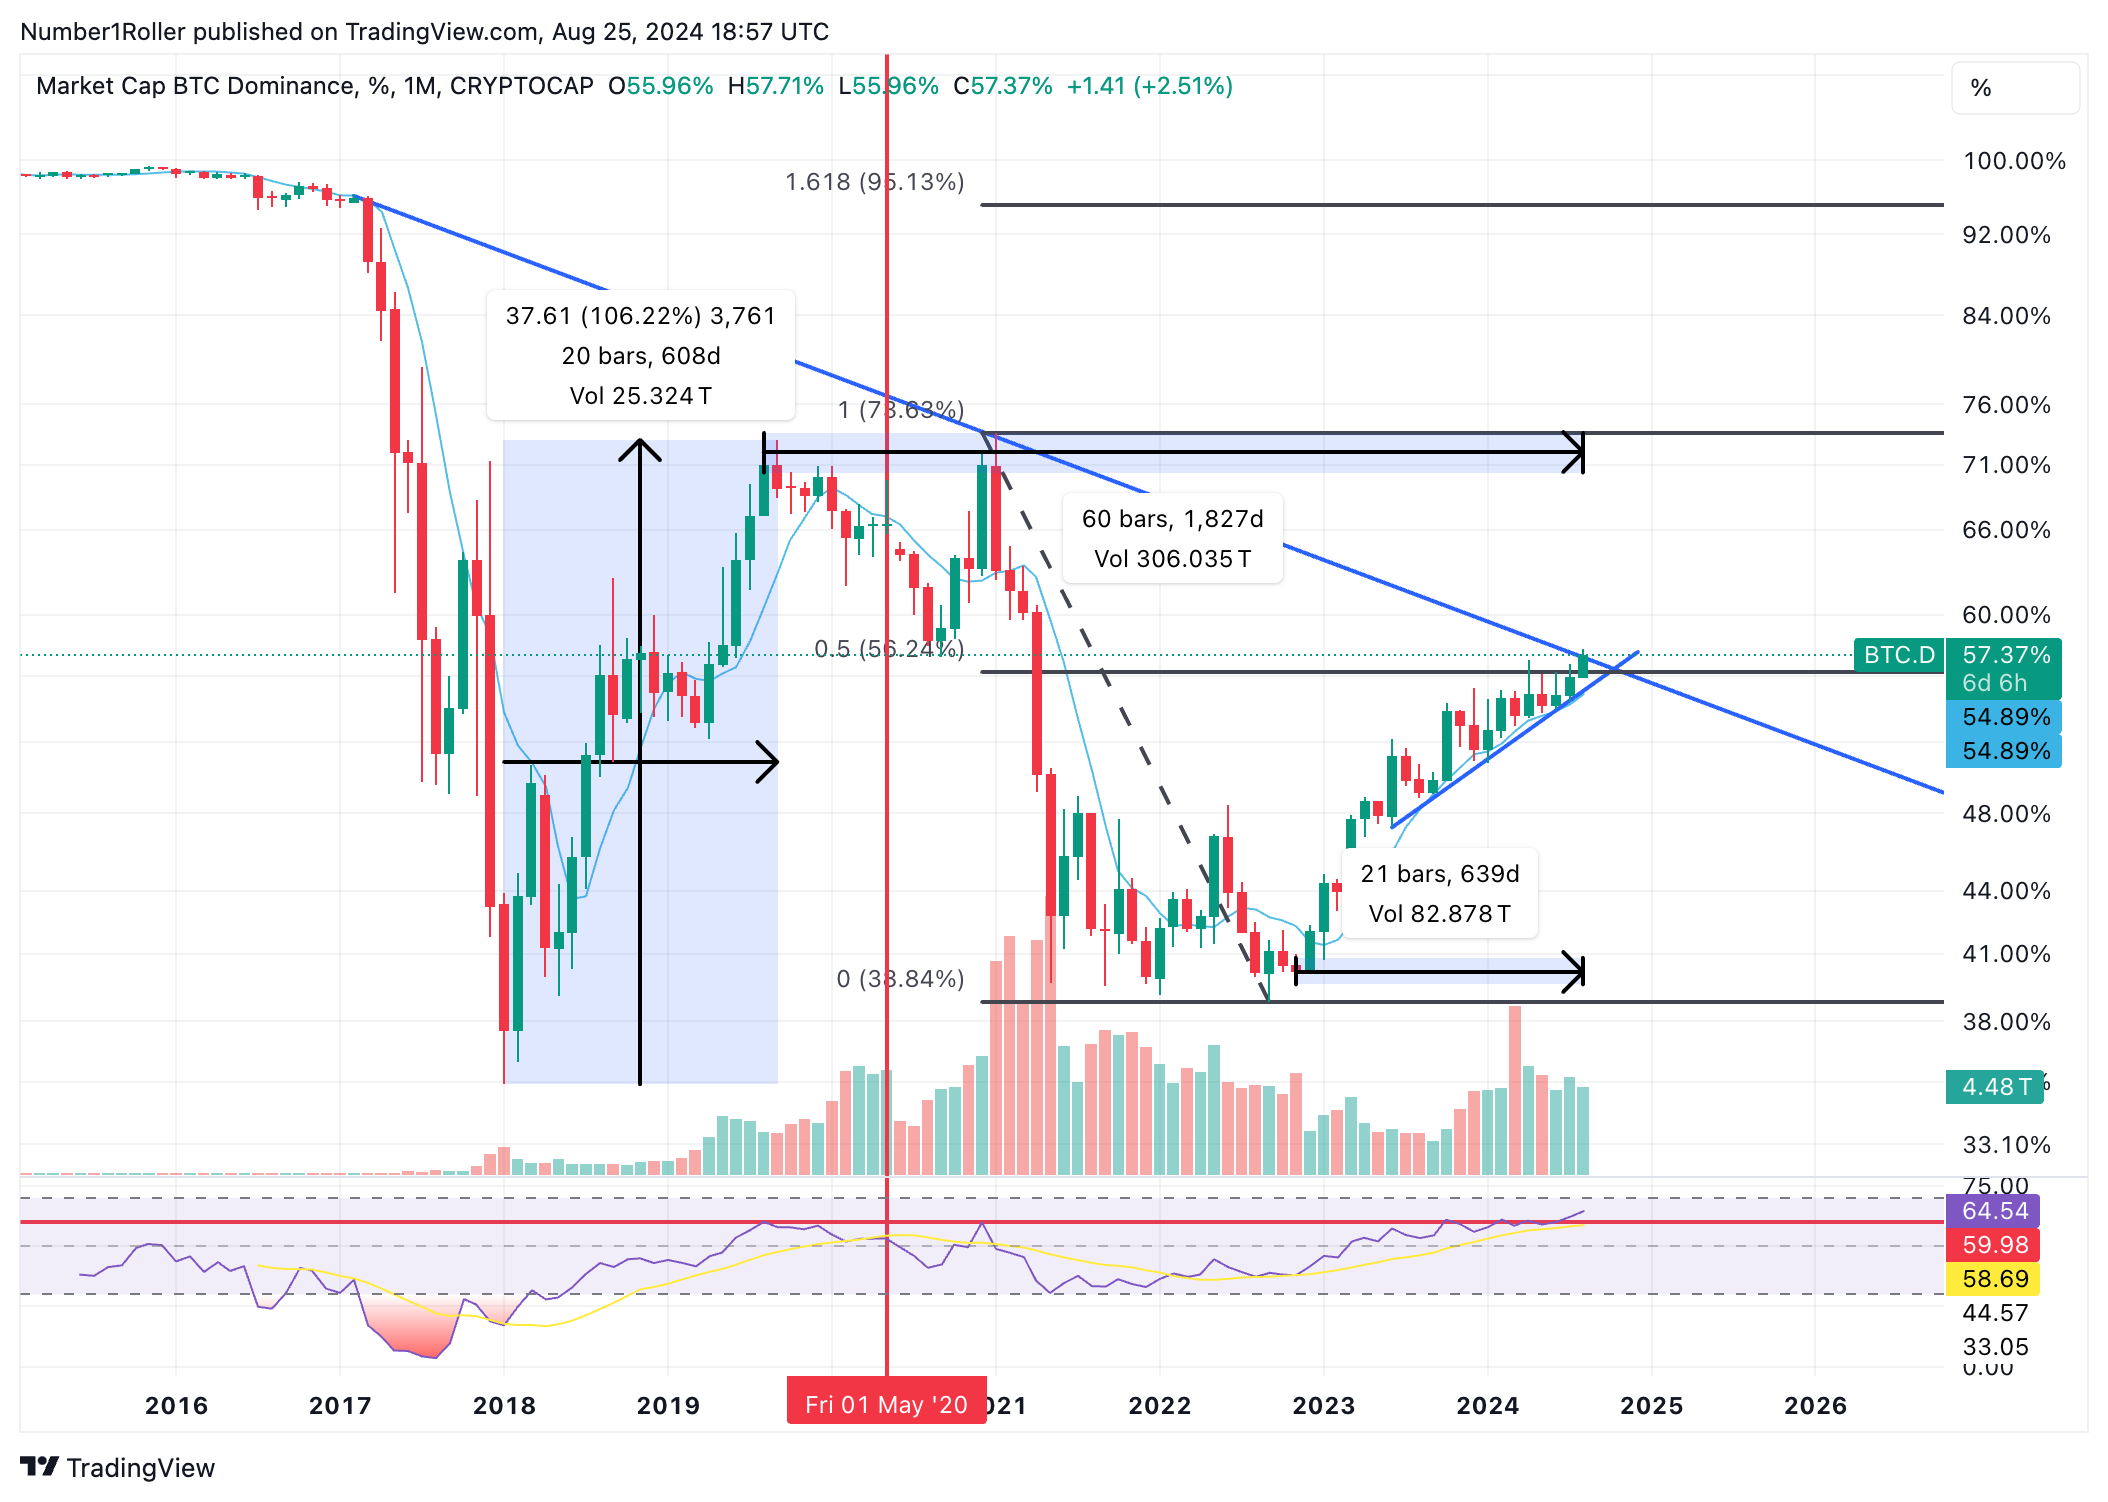
The BTC dominates the monthly chart as soon as possible.It also happens to be 21 months from the main lows and 60 months from the 2019 high, reaching its peak after a 20-month run.There is no doubt that this is worth paying attention, as altcoins also reach a critical turning point in their respective cycles.
Ethereum
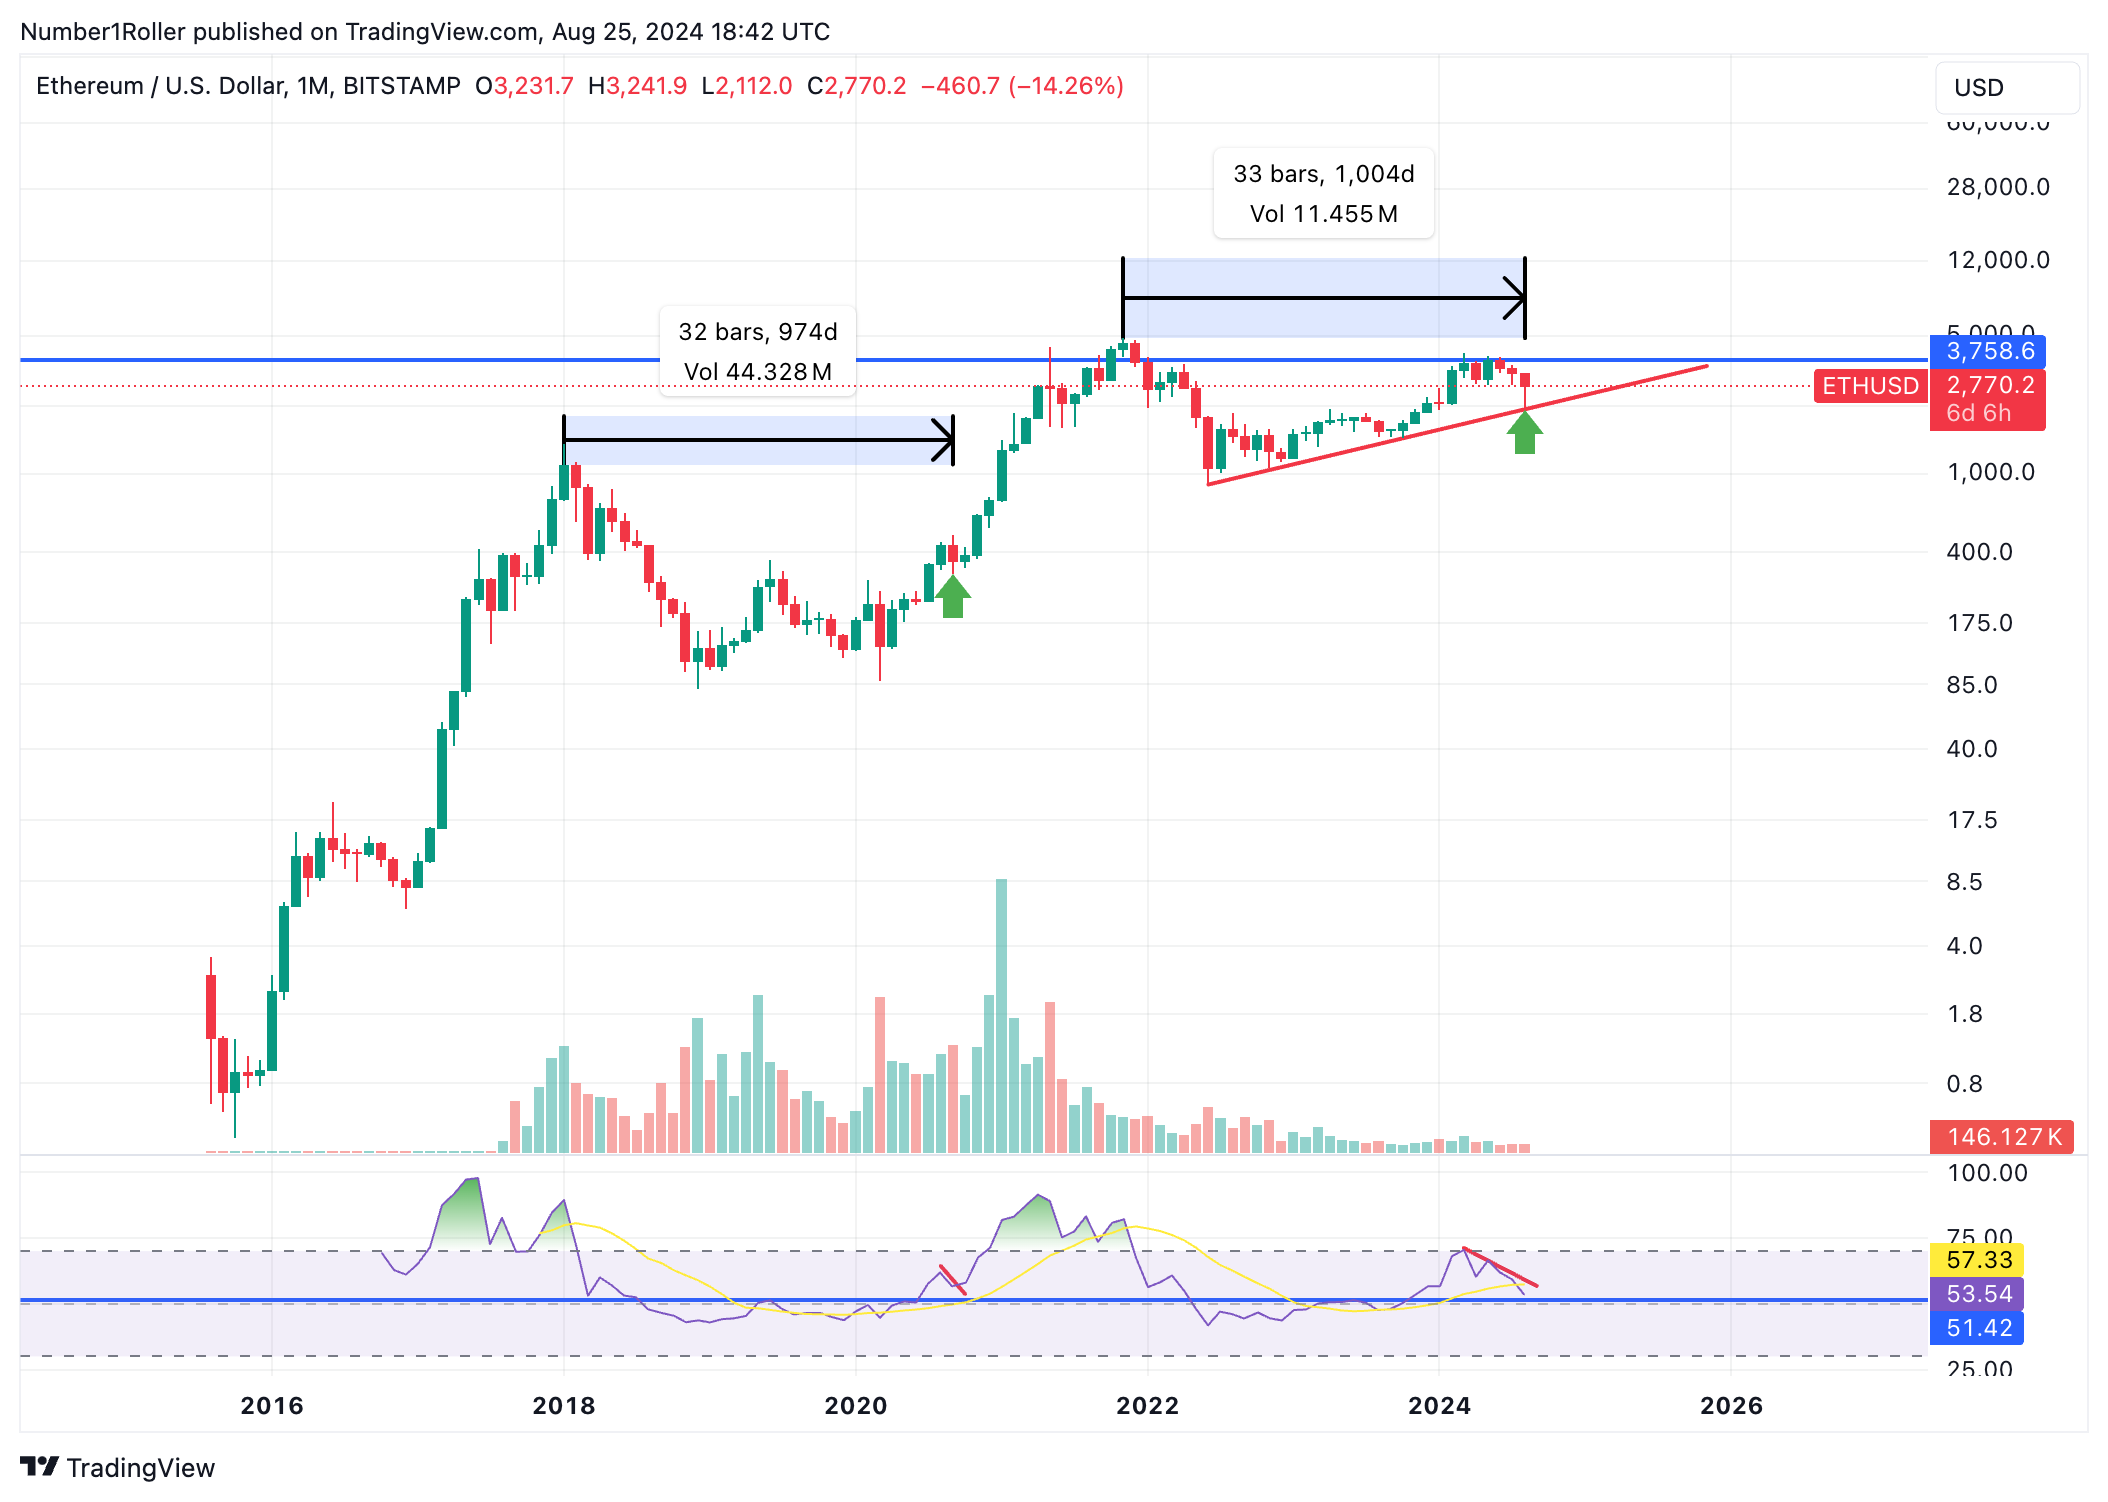
This is the monthly trend chart of ETH.Despite the lot of opposition from ETH, this chart seems pretty good in my opinion.Signal candles appear 32 and 33 months after the highs, and RSI is on bullish.Shrink again and keep it simple, it’s amazing how panicked the market is when things look so strong.
ALTS
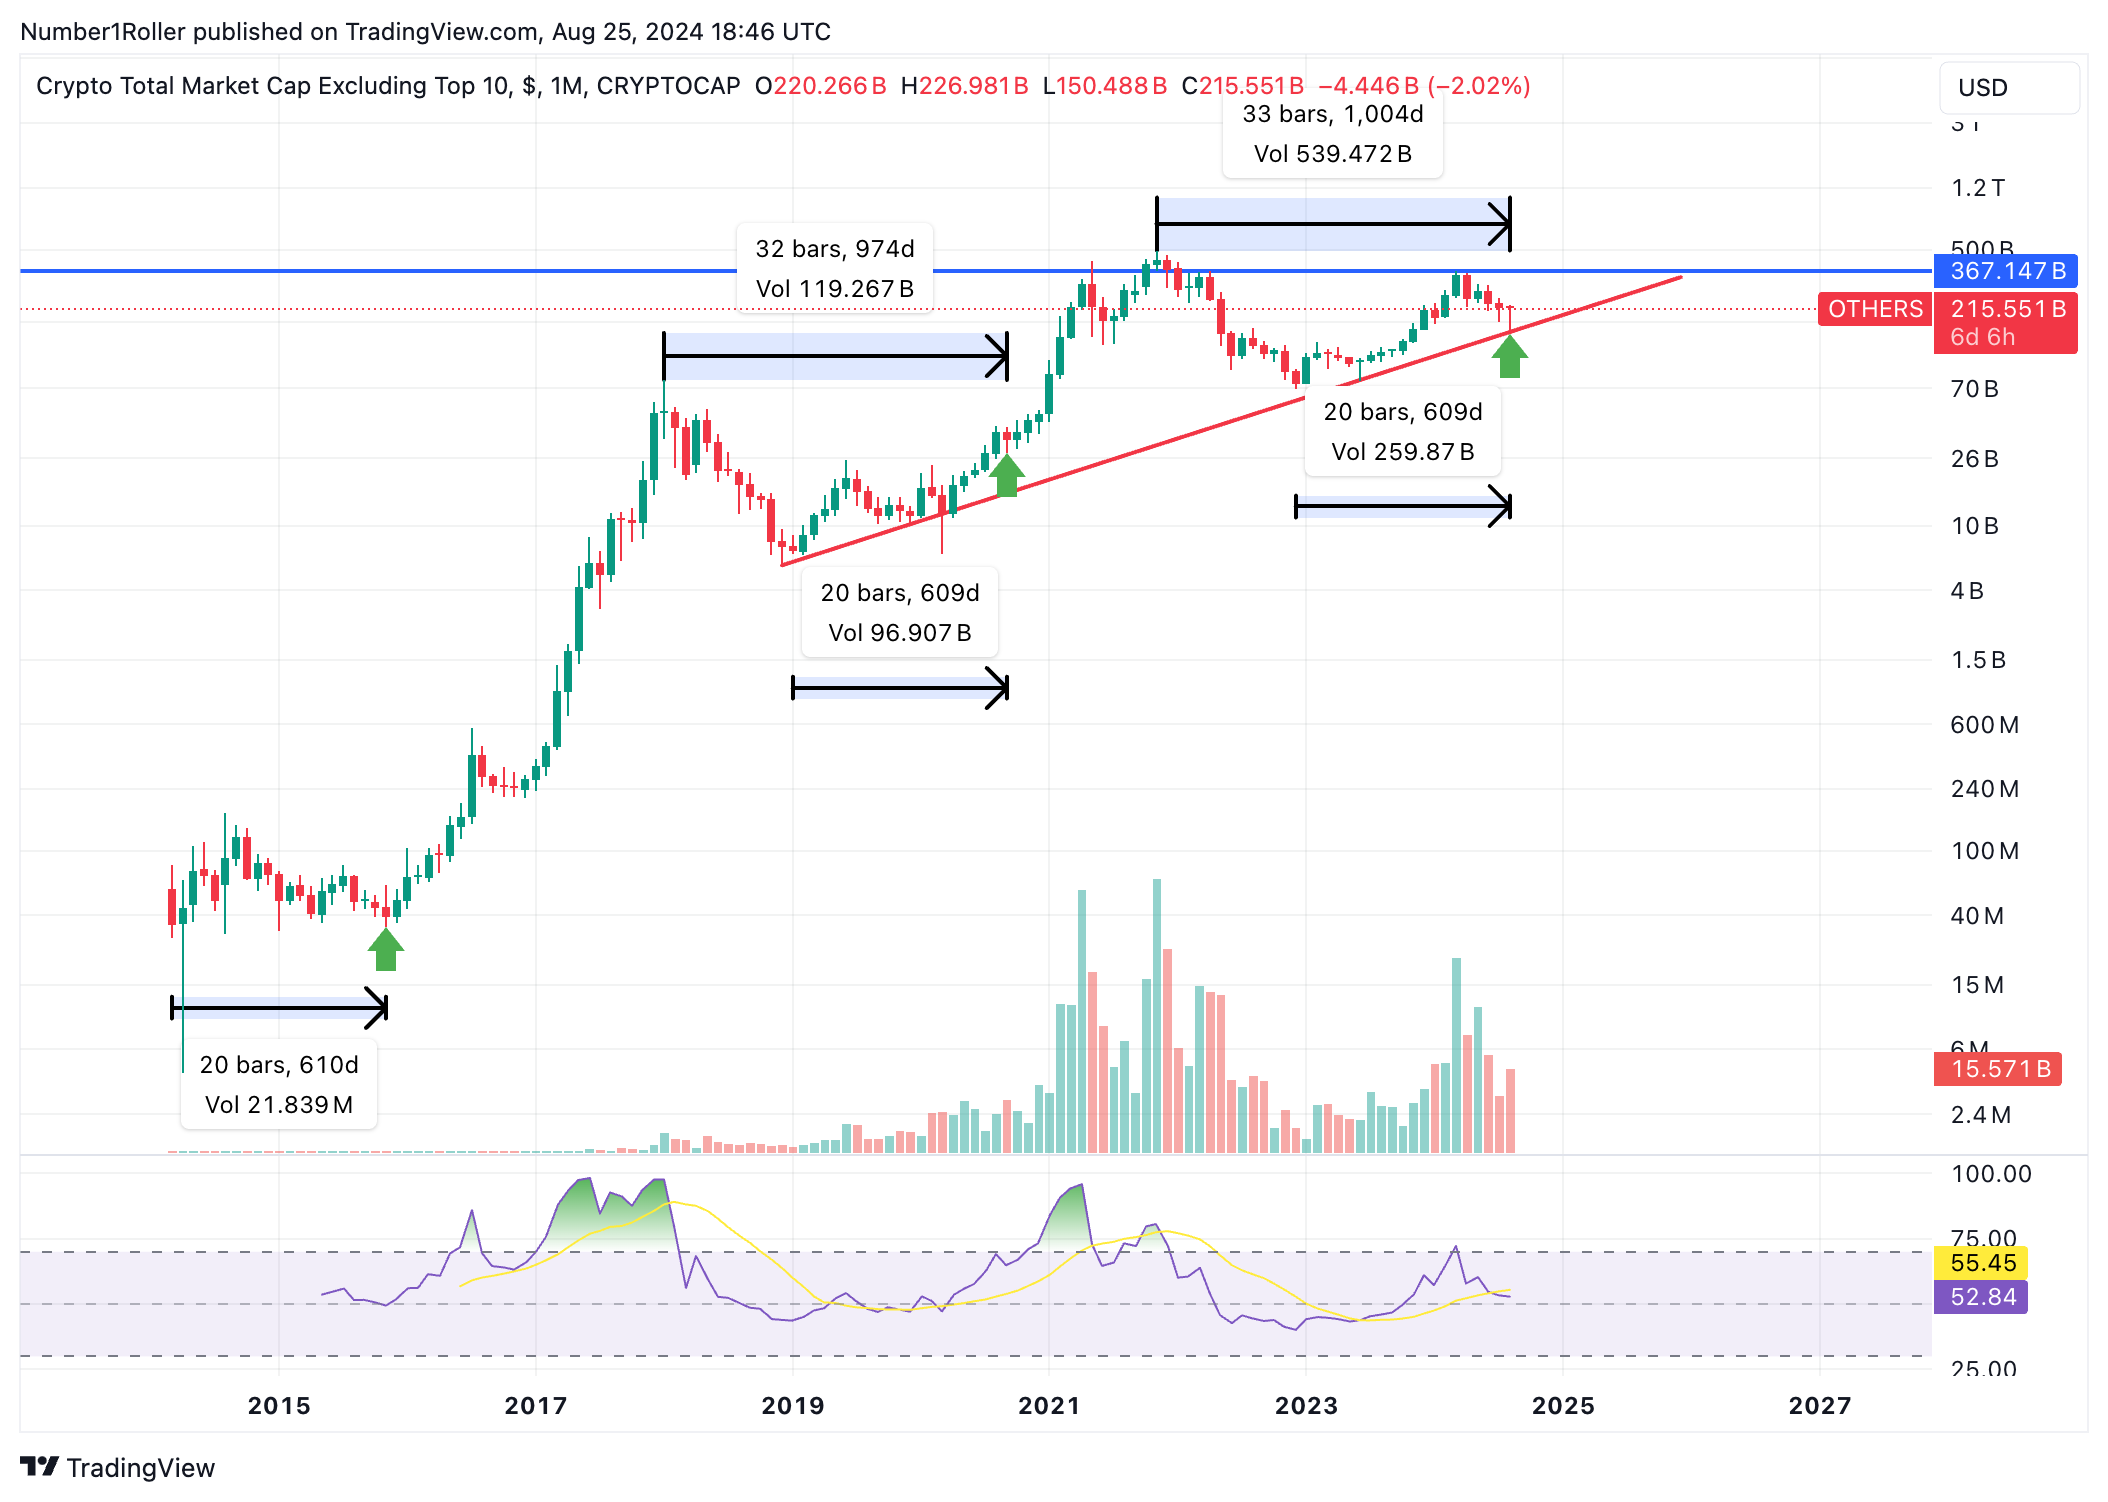
Other stocks dominate the monthly chart.The same is true.Before a sharp rise, each cycle has a 20-month low to low.We have 32 months and 33 months to top, and the big reversal candle is forming.This is your best chance to buy an alternative product in the last 12 months.Don’t miss it.
in conclusion
As can be seen from the chart above, big things are brewing in the cryptocurrency market.Time and prices are moving towards a major breakthrough in the coming weeks.We warned readers of this opportunity a few months ago, and now it is here.It’s time to stand up and execute.Block out all noise and make time and price your guide.The signals they send us are rare and undeniable.