
Author: danny; Source: X, @agintender
Recently, the “little horse and cart” roller coaster performance of demon coins such as $MYX, $AIA, $COAI, etc. not only caused countless traders to suffer huge losses, but also pointed the finger at the exchange’s liquidation mechanism and risk control capabilities.The violent “pump and dump” technique reveals a contradiction: Exchanges rely on volatility to earn handling fees, but out-of-control fluctuations may exhaust insurance funds and even shake market trust.
This article attempts to speculate on the balance between maintaining market activity and system solvency from the “first perspective” of exchange risk control.We will analyze from the perspective of the exchange how it can isolate manipulation behaviors in advance through a hierarchical monitoring system and advanced quantitative algorithms, such as position concentration ratio (OICR) and order flow toxicity (OTSI).
Secondly, for professional traders who hope to survive and make profits under this framework, some self-avoidance guidelines are provided: how to monitor their own ADL priorities and individual position ratios in real time to avoid being labeled by the risk control system as “potential short sellers” or “market manipulators” that pose a threat to the exchange.In the Wild West of crypto derivatives markets, the secret to survival is understanding the rules — and that untouchable line.
Note: This article only deduce the algorithm of the exchange from an external perspective without any internal information. It is for reference only. It is for the purpose of academic exchange and assumes no responsibility..
1. The core strategic needs of exchanges: balancing volatility and solvency
As a financial infrastructure that provides trading venues and clearing services, the core goal of an exchange is to seek a dynamic balance: while not strictly limiting market volatility to maximize fee income, it must not let such volatility threaten its own solvency and market reputation.
1.1 The exchange’s “double constraints” and commercial demands
1.1.1 Maximizing fee income and allowed volatility
The increase in transaction volume directly drives fee income.Severe price fluctuations, even those caused by pump and dump (P&D), will attract a large number of speculators to enter the market, thus driving up trading volume.Therefore, exchanges do not exclude all fluctuations and even require a certain degree of speculation to maintain market activity.
1.1.2 Avoid own losses and systemic risks
The exchange’s Insurance Fund is the bottom-line capital pool for perpetual contract trading.This fund is used to absorb losses arising from high leverage trading positions (that is, the liquidation price is lower than zero, or lower than the bankruptcy price of the counterparty).Once these losses exhaust the insurance fund, the exchange will be forced to activate the Auto Deleveraging (ADL) mechanism.The ADL mechanism, because of its characteristics of punishing profit-makers and closing hedging positions, is a helpless “democratized” break-even model.It is worth noting that the frequent activation of ADL not only affects the reputation of the exchange, but also because ADL serves as the last firewall, the activation of this mechanism means that the insurance fund has bottomed out.
1.1.3 Public opinion pressure and market integrity
P&D incidents, especially violent crashes in low-liquidity assets, will bring serious losses to the majority of users, thereby triggering huge public pressure and damaging the brand reputation of the exchange.Therefore, the exchange needs to isolate in advance those manipulations that may lead to systemic failure, even if it allows a certain degree of speculative volatility.
Conclusion
The bottom line for an exchange isHow to let the market play freely without losing money yourself.The goal of the risk control system is not to eliminate all P&D;Preemptively identify and intervene before P&D becomes a systemic crisis that drains insurance funds.Once the risk control is triggered, you may be questioned and restricted from placing orders; at worst, your account may be banned, funds frozen, or even judicial intervention.
1.2 Risk classification and monitoring weight
Category The model of traditional exchanges, we speculate that exchanges should also adopt a hierarchical governance model to ensure that risk control measures match the inherent vulnerability of the contract.Carry out risk-level management of contracts and focus monitoring resources on “high-risk contracts” (Tier 1), because manipulators only need to use less capital in these contracts to exert a disproportionate impact on prices.
Hierarchical logic and monitoring weight distribution: (example)
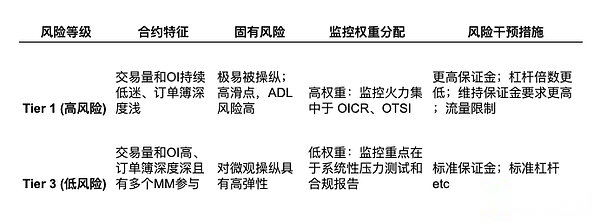
Risk control logic: The higher the risk level of a contract (such as MYX, AIA, COAI, etc.), the greater the possibility of being attacked by P&D strategies, and once liquidation occurs, the probability of liquidation losses being absorbed by the insurance fund is also higher due to lack of liquidity.Therefore, exchanges generally adopt a “high-pressure” monitoring mode for Tier 1 contracts.Increase the margin, reduce the leverage, and reduce the position holdings of the current accountTo mitigate leverage risks, and use indicators such as high-frequency algorithms (such as OTSI) to quickly identify manipulation behaviors, thereby triggering intervention during the risk accumulation period.
2. The exchange’s monitoring indicators and quantitative algorithms (risk control system)
In order to preemptively intervene and curb manipulation, the exchange’s risk control system deploys multi-level, high-dimensional algorithms to monitor market behavior.This article will start fromPosition concentration(P&D accumulation stage),genetic abnormality(structural pressure) andOrder flow toxicity(High frequency control) will be discussed from three basic angles.
2.1 Algorithm indicator 1: Position concentration and accumulation detection (OICR)
The exchange’s core concern is that “a single entity has disproportionate control over the market.”Therefore, monitoring open interest concentration is critical.
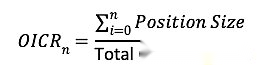
Indicator: Open Interest Concentration Ratio (OICR)
OICR measures the total open interest of the top trading entities (for example, the top 5 or 10 accounts) as a proportion of the total OI for that contract.
Quantitative Alert Example (Tier 1 Contract):
-
scene: The total open interest (OI) of a Tier 1 contract is 1 million.After identification of related accounts, it was found that the top three accounts had quietly accumulated 750,000 contracts in the past 24 hours.
-
Calculation and Alerts: OICR = 75%.If the exchange’s internal alert threshold for this contract is OICR > 60%, the system will immediately trigger a “concentrated accumulation” alert.This marks the end of the P&D accumulation phase and potential pull-back behavior is about to begin.
-
It is worth noting that even diversified account positions can easily be marked by similar trading methods, funding sources, etc.
2.2 Algorithm Indicator 2: Order Flow Toxicity Detection (OTSI)
Spoofing is one of the core tactics in the P&D execution phase, that is, submitting a large order butIntent canceled before execution, creating false liquidity and demand.The exchange’s systems identify this “toxicity” by analyzing the efficiency of order flow.
-
Indicator: Order to Trade Ratio (OTR)OTR measures the total number of orders submitted and canceled compared to the actual volume of trades executed.Excessively high OTR is one of the key indicators of spoofing.
-
OTR = Total Order Submissions and Cancellations / Total Executed Trades
-
It is worth noting that spoofing is usually accompanied by a large number of wash trading, creating a trend of amplifying prices and trading volumes.
Quantitative Alert Example (High Frequency Account):
-
scene: Within 1 minute of a certain moment of high volatility, a high-frequency trading account submitted and canceled 400,000 orders, but only executed 80 transactions.
-
Calculation and Alerts: OTR = 400,000 / 80 = 5,000.If the average OTR of the contract’s legal market maker is below 500, the system will trigger a “toxic order flow” alert for the account because its OTR far exceeds the average.This may result in immediate traffic limits being imposed on the account’s order submission rate.(Data are examples only, do not take them seriously)
2.3 Algorithmic Indicator 3: Spot-Futures Basis Anomaly Detector (SFFBAD)
Exchanges need to prevent extreme price dislocations from triggering large-scale liquidations.The basis (Futures Price – Spot Price) reflects market sentiment and arbitrage efficiency.
-
Indicator: Standardized Basis Deviation (SBD)Calculate how many standard deviations the current basis deviates from its long-term (e.g., 30-day rolling) average.
Quantitative alert example
-
scene: The average basis difference (Premium) between futures and spot for a certain Tier 1 contract is +0.2%.However, during a certain market pull, due to concentrated buying by manipulators in the futures market, the basis instantly surged to +6.0% (a very high premium).
-
Calculation and Alerts: If the 6% basis is statistically equivalent to a deviation of 5 standard deviations from the mean (SBD > 3.0), and this deviation persists for 15 minutes, the system will issue a “structural stress” alert.This signals a price dislocation (often driven by speculation or manipulation) that could lead to high liquidations and portends crash risk.(Data are examples only, do not take them seriously)
3. Self-avoidance strategies of project traders: quantitative indicators and ways of survival
For professional traders or project parties, the most important thing isAvoid being flagged by the exchange’s risk control system as a threat to system solvency and market integrity.This requires traders to master a set of “anti-risk control” self-monitoring indicators. Here are a few common indicators.
3.1 Core Risk 1: Systemic solvency risk (insurance funds and ADL)
exchangeinsurance fundIt is a buffer that covers the loss of the position.Traders must regard the health of the insurance fund as affecting their own trading security.systemic risk.
Quantitative avoidance strategies for traders
3.1.1 Monitor ADL Priority
This is the most direct risk indicator for traders.Exchanges will usually provide a real-time grade for this indicator (e.g. Level 5).The higher the level, the greater the risk that the position will be forced to be liquidated when ADL is activated. From the perspective of who profits and who is the biggest suspect, this situation should also be avoided.
ADL Priority = Profit Percentage / Effective Leverage
-
evasive action: The trader must take the initiative to partially close the position when the ADL level reaches a high level (such as 4/5 or 5/5).This reduces the “Profit Percent”, thus lowering its own ADL priority to the safe zone (e.g. 2/5).
3.1.2 Pay attention to insurance fund dynamics
Monitor the balance of the insurance fund of the trading pair and the exchange announcements of the same category of trading pairs to determine the policy direction. Traders should regard them as macro indicators of systemic stress.Any sharp decline in fund balances should be considered a systemic risk alert, indicating that ADL risk is increasing.
3.1.3 Avoid high leverage
Exchanges have higher margin and risk control requirements for low-liquidity contracts (Tier 1).Traders should increase margins to dilute effective leverage to reduce the risk of being targeted by the system when the market fluctuates violently.
3.2 Core Risk 2: Centralized Control and Manipulation Risk (IOIR)
Traders must avoid allowing the positions of any single or linked account to dominate the contract, especially in low-liquidity contracts.
Quantitative avoidance strategies for traders
-
Self-calculated IOIR: Individual Open Interest RatioIOIR = Your Position Size / Total Contract Open Interest (OI)
-
avoidance target: In high-risk (Tier 1) contracts, strive to control the IOIR of the account below n% to avoid triggering the “large account report/concentration alarm” within the exchange.If the amount of capital is large, positions should be diversified to avoid rapid and concentrated accumulation of OI in a short period of time.
3.3 Core Risk 3: Order Flow Toxicity (OTR)
Traders must ensure that their algorithms and trading patterns are consistent withLegitimate market making behaviorBe consistent with, rather than withDeception and manipulationcharacteristics match.
Quantitative avoidance strategies for traders
-
Monitor OTR: Continuously monitor the OTR of your own account.Although formal market makers (providing liquidity) have higher OTRs, their order submission and cancellation patterns are often balanced and two-way.
-
Avoidance mode: Execution of the following patterns marked as manipulation is strictly prohibited:
-
One-sided spike: OTR has unilateral and extreme spikes, such as a large number of orders submitted on the buying side, but the buying orders are immediately canceled after trading on the selling side.
-
liquid vacuum: Avoid operations that cause the depth of one side of the order book to collapse rapidly in a matter of seconds (a depth collapse of more than 70%).This will be flagged by the system as creating a “liquidity vacuum” and is a strong sign of manipulation.
It should be noted that the above indicators are only some conventional quantitative indicators. If you have not established the above self-monitoring yet, please think again.
I forgot where I heard the joke: Since what you are doing is snatching food from the tiger’s mouth, you must be prepared to return the jade to Zhao intact.
Finally, I suggest you take a look, but I don’t recommend you operate it.


