
source:VanEck;Compiled by: Bitchain Vision
As with most emerging asset classes, allocating Bitcoin is both an art and a science.
However,Three measurable factors consistently explain the majority of BTC price movements over time: global liquidity, leverage, and on-chain activity.Together, these factors provide investors with a practical framework for sizing and timing digital assets.
1. Global Liquidity
BTC price is highly correlated with global M2
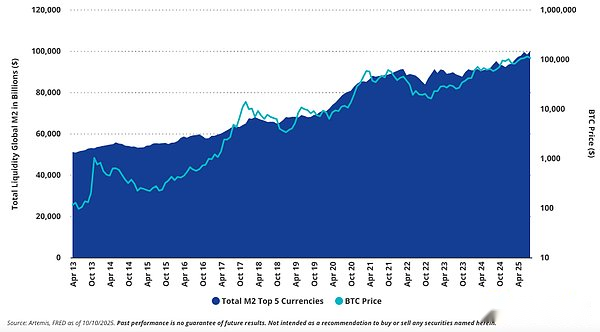
The price of BTC has long been closely tied to the rise and fall of the global money supply.Since 2014, Bitcoin’s correlation with global M2 total growth has been approximately 0.5 (r² = 0.25), meaning changes in fiat liquidity largely explain its long-term returns.
While this relationship tends to weaken during short-term shocks (such as the COVID-19 pandemic in 2020, the 2024 election, or the “tariff scare” in 2025), the broader trend of monetary expansion still dominates Bitcoin’s cycles.A multivariable regression analysis of the supply of the five major fiat currencies and the price of Bitcoin shows that changes in M2 explain more than half of the variance in Bitcoin over the past decade (r² = 0.54).
Liquidity among the world’s five largest currencies has roughly doubled since 2013, from $50 trillion to nearly $100 trillion, during which time the price of Bitcoin has increased more than 700 times.Across currencies, Euro M2 money supply remains the strongest explanatory variable (r = 0.69, t = 10), highlighting Bitcoin’s growing role as a neutral reserve asset in the context of synchronized currency depreciation.
VanEck’s historical macro view is consistent with these data.In March 2023, VanEck CEO Jan Van Eck said on CNBC that both gold and Bitcoin appear poised to enter a multi-year bull market cycle as the Federal Reserve nears the end of its tightening policy.Within this framework, VanEck’s thesis is that Bitcoin acts as “digital gold” and will benefit when banks weaken and interest rates are about to be cut and liquidity expands again.
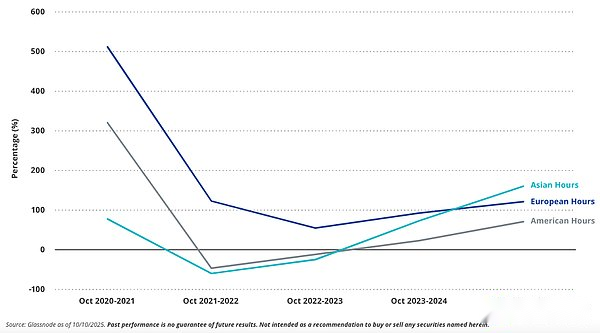
When it comes to Bitcoin price discovery, regional market dynamics have changed significantly over the past two years.As shown in the chart below, while earlier in this cycle and in the 2020-2022 cycle, Bitcoin returns during Asian trading hours lagged behind Western trading sessions, now Asian trading hours lead Bitcoin returns globally.This year, we have observed that Asia led the recent late-summer rally and is now leading the recent decline.This rotation may reflect tighter liquidity in Asian markets, because the central banks of India and China are willing to sacrifice domestic currency growth to defend their currencies.This pattern is consistent with Bitcoin’s role as an “anti-money printing” asset in global liquidity cycles.
BTC trading session annualized average hourly return
2. Leverage
BTC price is closely correlated with BTC futures Open Interest (OI)
Leverage is both a driver and a consequence of Bitcoin’s monetization process.Nearly 73% of Bitcoin price movements since October 2020 can be explained by changes in futures open interest (t = 71), which highlights the reflexive relationship between speculative positions and spot prices.Historically, periods of high leverage have tended to precede market corrections, with orderly phases of deleveraging marking attractive entry opportunities.
Before the plunge on October 11, BTC futures open interest (OI) increased 2.5 times year-on-year.
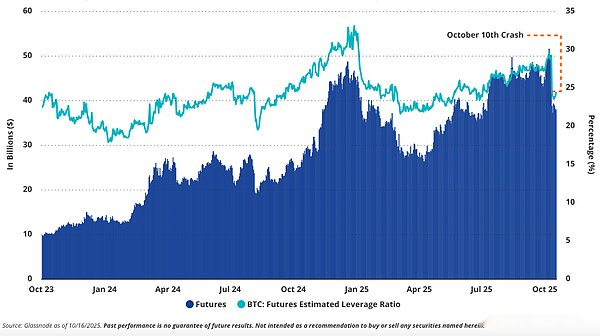
As of early October 2025, the futures leverage ratio is close to 95%, and the cash collateral of Bitcoin futures has reached an all-time high (approximately $145 billion).Open interest peaked at $52 billion on October 6, then fell back to $39 billion on October 10 after BTC fell 20% in eight hours, a reminder of how margin calls are layered through the system.Notably, leverage has never remained above 30% for more than 75 days, suggesting continued limited risk appetite.As of mid-October, Bitcoin futures leverage was at the 61st percentile of its historical range over the past 5.25 years..
At the same time, the composition of leverage is also maturing.The increasing participation of institutions, miners and ETF market makers has caused trading activity to shift to regulated venues such as the Chicago Mercantile Exchange (CME).At these venues, longer-term, hedging-oriented contracts dominate.Leverage remains a double-edged sword that not only amplifies drawdowns but also reflects growing confidence in Bitcoin as a financial asset.
Against the backdrop of the October 11 deleveraging event and Bitcoin prices reaching their lowest levels since October 2024 relative to gold, we view the current market as a buying opportunity.
3. On-chain activities
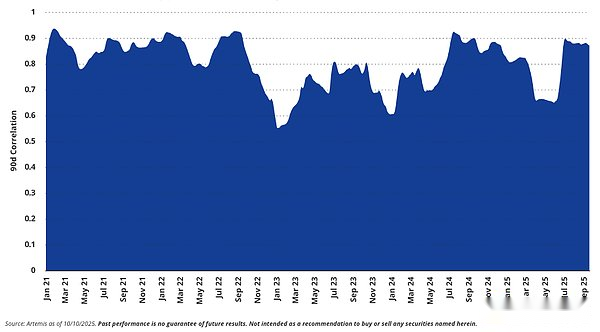
1-year correlation between blockchain revenue and token prices
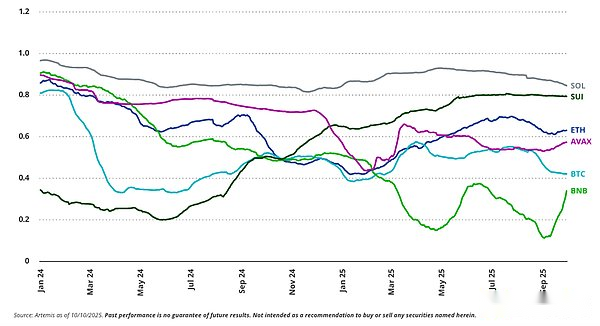
While macro liquidity and market structure are indicators of Bitcoin’s short-term cycles, and these indicators generally influence risk appetite across the cryptocurrency market,On-chain fundamentals are the clearest window into the actual application of cryptocurrencies.Across major networks, token prices show a statistically significant correlation with the revenue generated by their blockchains, proving that usage and value are intertwined.
Among the large blockchains, Solana has the strongest correlation between network revenue and token performance (r² = 0.71, t² = 30), while Binance Chain’s BNB has the weakest correlation (r² = 0.13).The cause-and-effect relationship between the two is complex: higher token prices catalyze more revenue-generating user activity, while continued fee income strengthens long-term valuations.As major blockchain application ecosystems mature, they provide new channels of activity that can improve the relationship between price and on-chain revenue.As the newest member of the six blockchains in the chart above, Sui’s network growth over the past two years in DeFi and consumer gaming/NFT applications is the clearest evidence of this relationship.
For Bitcoin, on-chain metrics like transaction volume and network fees remain less predictive of daily price movements than liquidity or leverage.However, they are still strong evidence of network health.We think,Bitcoin (and to a lesser extent Ethereum) is relatively less disconnected from these fundamentals than other blockchain networks, as they are increasingly used as store-of-value monetary assets by off-chain vaults and exchange-traded products (ETPs).While these factors are favorable for BTC and ETH, continued growth in on-chain revenue and user activity is the strongest evidence that blockchain networks’ value proposition transcends speculation.
On-chain metrics aside, Bitcoin is still like an “eight-year-old” on its adoption curve, as Jan van Eck described it in 2023, but its growing correlation with global liquidity and leverage suggests thatBTC is evolving from a speculative asset to a macro hedge against fiat currency debasement.
Today, BTC is more like a teenager; although BTC is growing, we expect market sentiment to continue to fluctuate in the coming years.