Source: On-Chain Mind, compiled by: Shaw bitchain vision
Bitcoin has fallen 12% from its all-time high, and online discussions have suggested that the bull market may be over.But is this really the beginning of the collapse, or is it another typical wash-up in the volatility of Bitcoin?
In this article, I will compare the current market structure with previous cycles and find out the key levels that determine whether this adjustment is benign or more worrying.
Let’s get started.
Overview of key points
-
Historical background reveals the normal: Bitcoin’s current 12% pullback pales in comparison to the 20% to 40% drop that has frequently occurred in the past bull cycle, suggesting that this is just a regular volatility, not a trend reversal.
-
Key support levels are worth paying attention to: Short-term holders achieve price ($109,000) and moving average (200-day moving average $101,000, annual moving average $93,000) will determine whether the bull market trend will continue.
-
Changes in investor mentality: Think of callbacks as accumulation opportunities, which can turn fear into strategies, especially for long-term holders.
-
No signs of surrender yet: Indicators such as the achieved output profit ratio (SOPR) show profit rather than loss, indicating a sustained bullish structure.
Background analysis of Bitcoin callback
It has been about two weeks since Bitcoin fell back from its all-time high of $124,000.People will naturally ask questions: is this just a brief pause, or the beginning of a deeper contraction?
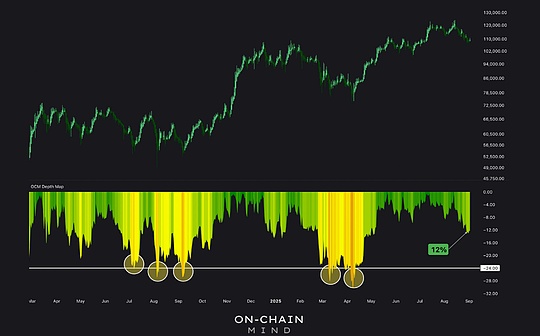
To illustrate the specific situation, we can view the depth chart, which measures the current price retracement relative to the previous historical high.
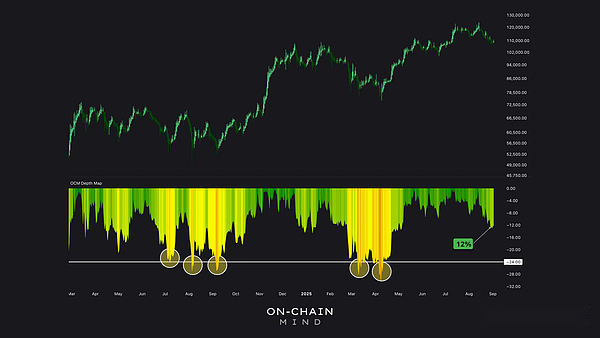
We have seen 5 other adjustments over the past year and a half, twice the 12% magnitude.
andAt least 5 times in the past year and a half, the decline exceeded 24%Compared with the situation, the 12% drop today is quite moderate.Although bearish sentiment is generally permeated on the Internet, data shows that Bitcoin has experienced a more serious decline before, and it is relatively close.
Lessons learned from previous cycles
It is crucial to compare the current market structure with previous cycles.A reference comparison is the bull market cycle in 2017, which also experienced a step-by-step rise until the final surge peaked.Here is the situation at that time:
-
A 20% adjustment is normal and happens almost every month during the rise.
-
Before the market continued to rise, there was a 30% or even 40% pullback.
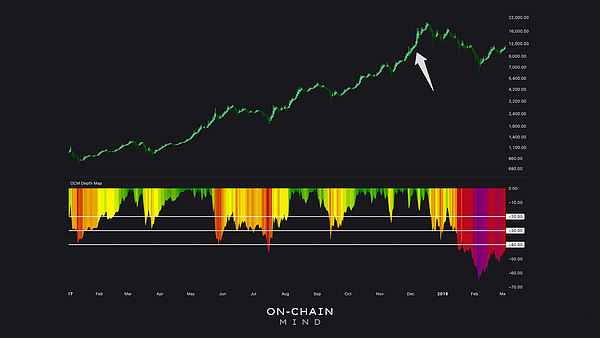
Although Bitcoin has evolved into a larger and more institutionally recognized asset since 2017, volatility remains an inherent feature.In fact, during this bull market, we have witnessed multiple 20% to 30% pullbacks.
So, will it surprise me to fall another 30%?not at all.This will bring the price to about $87,000, a level that seems to be sluggish but is within the historical normal range.
From a personal point of view, such a decline may be beneficial for net increasers like me.Lower prices create opportunities to increase holdings more bitcoins at attractive levels, while rising prices expand overall wealth – both are good things in my opinion.For investors with investment periods ranging from 5 to 10 years, these short-term volatility is essentially irrelevant.
When will I turn bearish?
A 30% to 40% pullback does not mean bearish in itself.Historical experience shows that the market will enter a long-term bear market only when the decline exceeds this level, such as after the plunge in 2018.At that time, it may take 2-3 years to reach a new all-time high.See below for details.
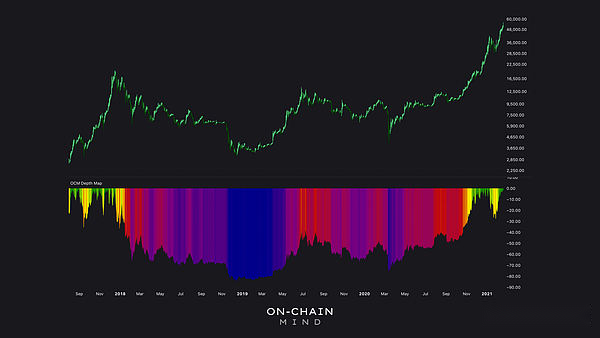
It will take many years to return to its previous highest point.If you miss the top, you may find yourself holding it for a long time.
At present, as long as the structural bullish trend remains unchanged, the market is still in a healthy state.
Key price positions I’m paying attention to
Short-term holders realize prices
Actual buying price of short-term holders (STH)Measure the average purchase cost of recent investors (more specifically, Bitcoin purchased in the past five months).It usually serves as a psychological support level:
-
Current STH implementation price:$109,000.
-
A price break below this level may cause new investors to lose patience or panic selling.
-
The deviation multiple, or my cost band, visually shows how far the price is deviated from this critical level.
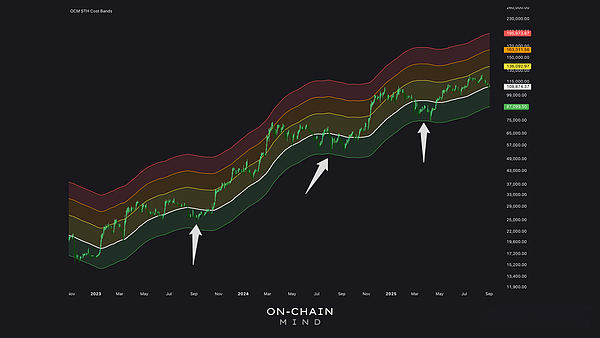
When the price trades in the green cost band in this bull market, it provides us with the best risk-reward opportunity in this cycle.
Green cost belt is currently locatedBottom of around $87,000(Interestingly, this is quite the highest all-time drawdown of 30%), marking the highest risk/reward accumulation area.While the market may hover around this level for months, there is usually a further upward momentum after the final sell-off ends.
200-day moving average
The 200-day moving average (MA) is a widely-watched technical indicator and usually represents long-term trend support.
-
Current 200-day moving average:$101,000.
-
Price testing at this price indicates a pause in the trend, but it does not necessarily mean that the market is weak.
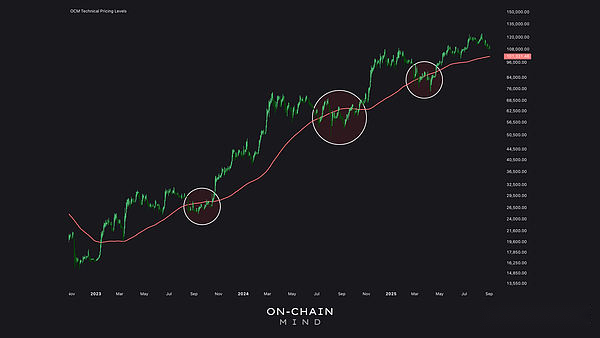
Whether in a bull or bear market, prices like to return to this level as a test of trend continuity.
From a statistical point of view, in a trend market, prices return to the mean.From a psychological perspective, this is an integer magnetic point (there is $100,000 nearby, which is quite attractive).Falling below this level may aggravate bearish sentiment, but even if the market fluctuates sideways, maintaining this level can maintain the bullish structure.
365-day moving average
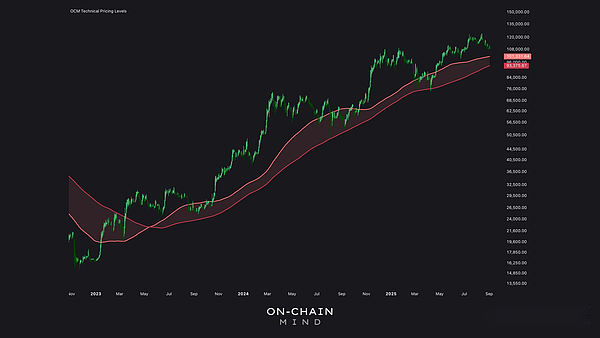
For me, the annual moving average defines the line between a bull and a bear market.
-
Current 365-day moving average:$93,000.
-
The vulnerability here will trigger a reassessment of the health of the broader market, especially the consumption behavior of investors and group selling dynamics.
Evaluate investor behavior using SOPR
The achieved output profit ratio (SOPR) measures the ratio between the selling price and purchase price of the token:
-
SOPR > 1(Purple): The token is in a profit-making state.
-
SOPR < 1(Pink): The token is in a state of sale at a loss, indicating that it has surrendered.
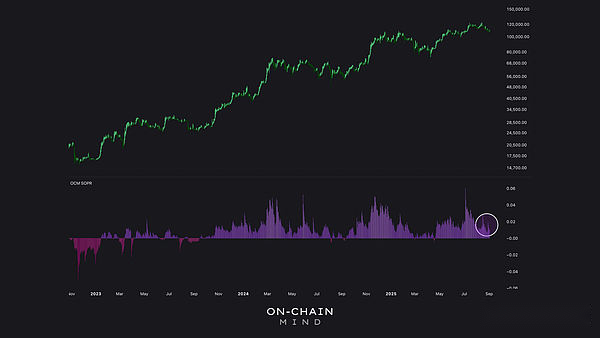
Even though SOPR is on a downward trend, it is exactly in line with our expectations for the current market stage.
Currently, the 7-day moving average of SOPR is still positive, indicating that active investors are making profits rather than losing money.If a dark pink signal appears and a 365-day moving average test appears, it may be a warning of potential structural weakness in the market.
Current strategy and mentality
Holding Bitcoin requires the risk of price fluctuations.
Bitcoin’s development history shows that patience is more important than reaction.In each cycle, 20% to 40% of callbacks are the norm. Although it feels serious, it is just a small episode in the long run.Amid a network craze, 12% drop?This is reasonable.
While deep pullbacks are always possible, rather than worrying, focus on key price levels:
-
STH realizes price: psychological support level is$109,000
-
200-day moving average: the trend confirmation point is$101,000
-
365-day moving average: the boundary line of bull market/bear market is$93,000
Holding these positions maintains bullish integrity, although you will see fluctuations in market sentiment.From a structural perspective, the bullish trend has not changed, and the overall market pattern has not changed.A pullback is just a normal phenomenon on the way up, and the trend is your friend until there is evidence to the contrary.


