Author: Yashu Gola, CoinTelegraph; Compiled by: Tao Zhu, Bitchain Vision
Crypto analysts’ debate over whether Ethereum bottoms out is not over yet, especially after its recent performance underperforms over the overall cryptocurrency market.
However, ETH has rebounded 28% since February, rebounding from a local low of $2,150 set two weeks ago.
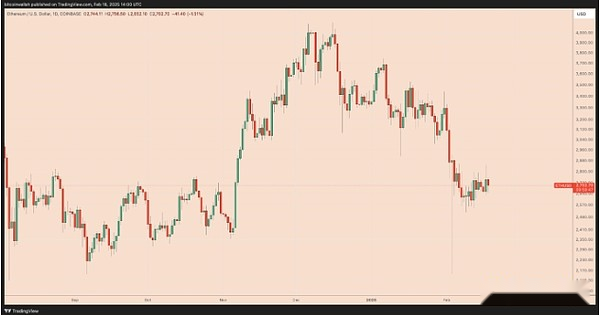
ETH/USD Daily Price Chart.Source: TradingView
Let’s see how analysts view Ethereum’s massive price recovery.
ETH will rush to $10,000 next
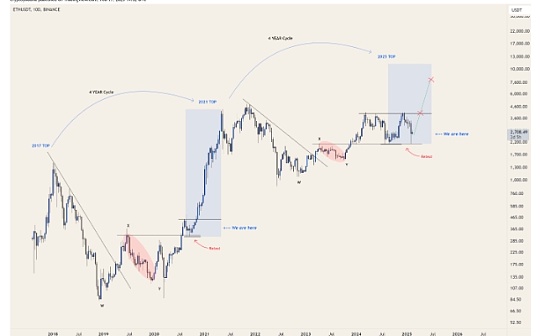
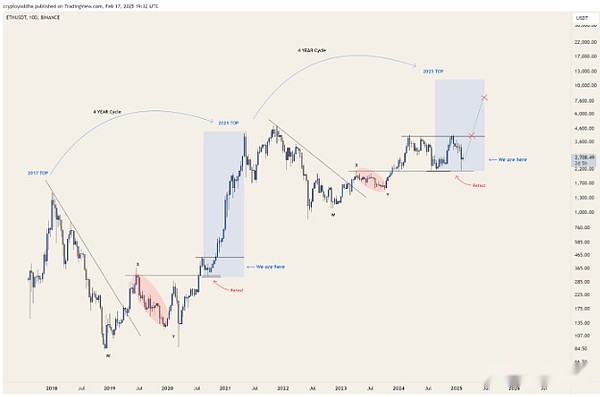
Crypto Yodhha, a well-known analyst, shared a chart that shows that Ethereum may have bottomed out, with a structure similar to the 2019-2020 cycle, and has since risen by 2,550%.
A key technical feature in the chart is the completion of the WXY correction mode, which is the complex three-wave correction structure in Elliott’s wave theory.
ETH/USDT 10-day price chart.Source: TradingView/Crypto Yodhha
This pattern usually indicates the end of a long-term market downturn by forming a W-shaped (initial decline), an X-shaped (temporary relief of rebound), and a Y-shaped (final adjustment wave), and then a new bullish trend emerges.
Crypto Yodhha also highlighted the range breakout scenario, where ETH needs to regain the upper limit around $4,600 to confirm the continuation of the bullish momentum.
If successful, the price could follow the trajectory of the previous cycle to hit an all-time high, expected in the $10,000-13,000 range.
Ethereum rebounds from key ‘weekly demand’ areas
The Ethereum weekly chart drawn by analyst Bottom Sniper highlights a key support area that can determine whether ETH can maintain its bullish market structure.
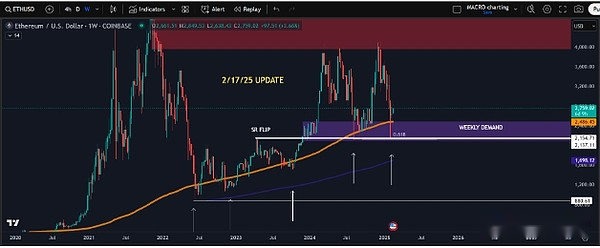
ETH/USD Weekly Price Chart.Source: TradingView
“The low of $880 during the bear market is between the gold/purple line, and you can find that there are 4 times (excluding the 2025 low) confirming key support levels.”
This area is consistent with several key confluence points:
-
61.8% Fibonacci Retracement (Wave 2 Correction) – Historic Strong Support Level in Bullish Market Structure.
-
Weekly demand zone – the area where buyers previously intervened.
-
SR (Support-Resistance) Flip-The previous resistance level now acts as support.
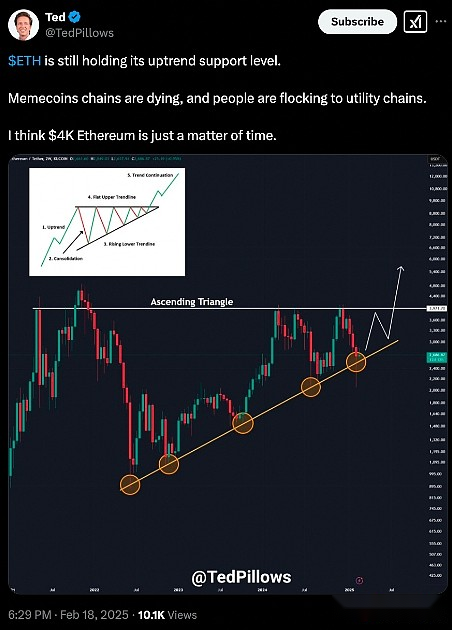
If the ETH price remains above the area, it may be confirmed that the bull market will continue to reach new highs, highlighted above the $4,000 area (red) in the chart above.Analyst Ted Pillows also believes that $4,000 is Ether’s next upside target.
Ethereum will “nowhere to go” in the next few months
Meanwhile, TraderXO’s daily Ethereum chart shows that ETH has returned to the three-month range that previously included price trends from August to October 2024.It shows a siege phase where ETH may be curled sideways until a significant breakthrough occurs.
It is worth noting that the key support level is $2,124, which has historically been a strong demand zone.If ETH returns to support, it may attract buyers who want to take advantage of the potential rebound, possibly moving towards the previous range high of around $2,850.
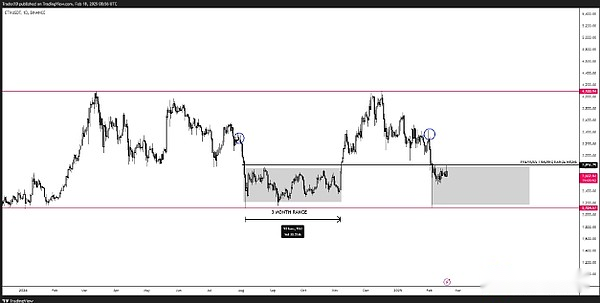
ETH/USD Daily Price Chart.Source: TradingView/TraderXO
TraderXO said: “Betting on the edge area…do nothing in the middle.”
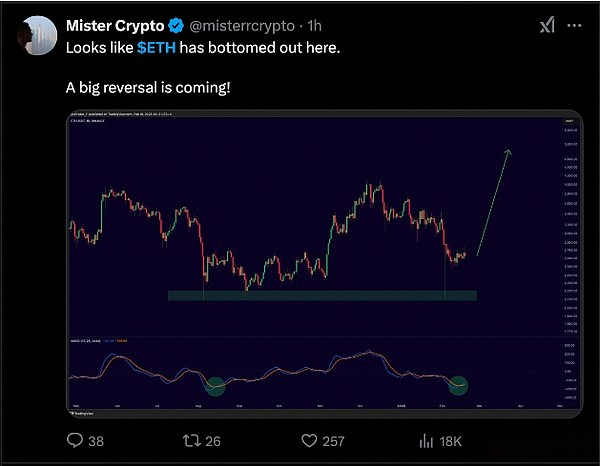
On the other hand, analyst Mister Crypto said Ethereum has bottomed around $2,124, noting that there will be a “big reversal” next.
Random RSI suggests ETH price bottoms out
Analyst TraderPA cited the classic stochastic relative strength index (RSI) indicator, believing that ETH may bottom out against Bitcoin after its recovery in February.
It is worth noting that the random RSI indicator shows that ETH/BTC has been below the 20 level for a full two years, and historically, the subsequent long-term increase in ETH prices.
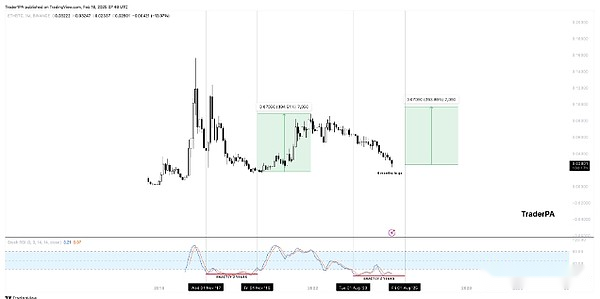
ETH/BTC monthly price chart.Source: TradingView/TraderPA
The chart highlights two previous examples – 2017-2019 and 2019-2021 – in both events, ETH/BTC was oversold until a massive rebound.
In both cases, Ethereum’s rise against Bitcoin exceeded 260%-390%, causing the altcoin to strengthen.The current setting reflects these past cycles and the next two-year bullish phase is expected to begin in August 2025.
Therefore, if fractals work, ETH/BTC may be on the verge of rebounding, which also supports the argument that Ethereum bottoms out in USD.