Source: Glassnode; Compiled by: Bitchain Vision
Key points of this article:
-
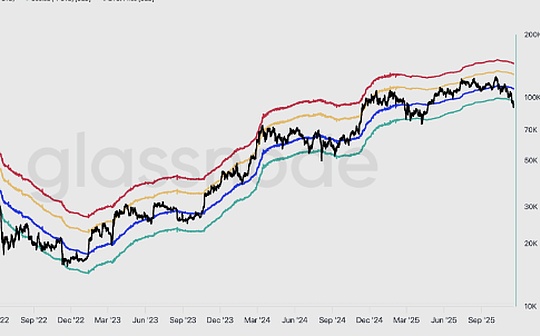
Bitcoin has fallen below the STH (Short Term Holder) cost base and the -1 STD (Standard Deviation) range, putting pressure on near-term buyers; the $95,000 to $97,000 area now serves as a key resistance level, and if it can be recaptured, it will mark an early step in the recovery of market structure.
-
Spot demand remains weak, with U.S. spot ETF inflows heavily negative and TradFi asset allocators not adding any buying.
-
Speculative leverage continues to decline, reflected in lower futures open interest across the top 500 assets and funding rates falling to cycle lows.
-
Options markets have significantly repriced risk, with implied volatility rising across tenors and skewness remaining low as traders pay high premiums for downside risk protection.
-
Put-led flows and demand at key strikes (e.g. 90K) have reinforced defensive positioning strategies, with traders more aggressively hedging rather than adding to upside exposure.
-
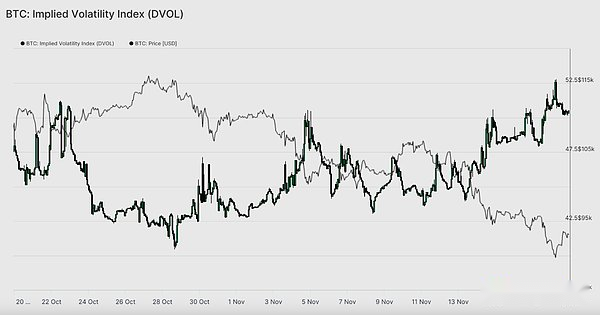
DVOL has recovered to monthly highs, linking a broad repricing of risks such as volatility, skewness and flow indicators and signaling expectations of a near-term rise in volatility.
Bitcoin broke out of its previous consolidation range, falling below $97,000 and reaching as high as $89,000, setting a new local low that turned its year-to-date gains into negative territory.This deeper decline continues the mild bear trend we highlighted last week and raises questions about the potential return of structural support.In this issue,We will use on-chain pricing models and short-term holder loss realizations to assess the market’s reaction to this drop.We then analyze options, ETF flows, and futures positioning to assess how speculators are adjusting to this new wave of weakness.
On-chain insights
Break through the lower track
A break below $97,000, the lower end of last week’s “swing range,” signals the risk of a deeper pullback.The price then plummeted to $89,000, forming a new local low below the -1 standard deviation level (around $95,400) relative to the short-term holding cost base (currently close to $109,500).
This decline confirms thatNearly all investor groups have suffered losses recently, a structure that historically triggers panic selling and sap market momentum that takes time to recover.In the short term, the range of $95,000 to $97,000 may constitute local resistance. If the price can regain its footing in this range, it will indicate that the market is gradually returning to balance.
Panic selling reaches peak
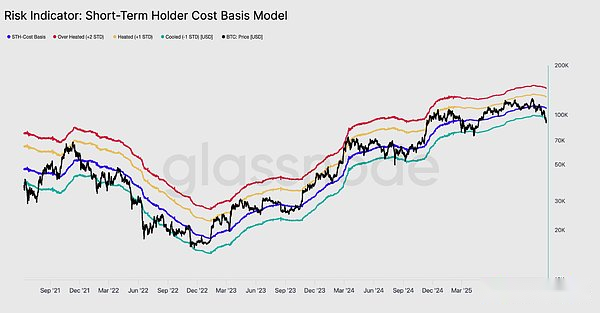
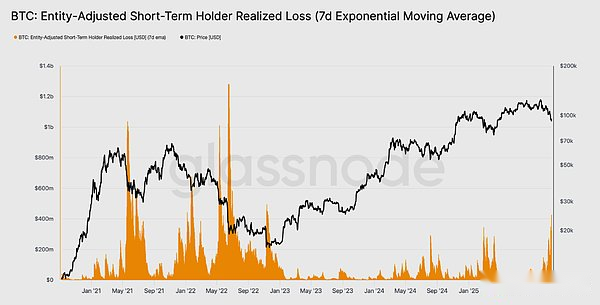
From the perspective of investor behavior, this plunge marks the third time since the beginning of 2024 that the currency price has fallen below the lower limit of the short-term holder’s cost basis model.However, the level of panic among top buyers is significantly higher this time around.STH’s 7-day moving average of realized losses has surged to $523 million daily, its highest level since the FTX crash.
Such high loss realization highlights the heavier top structure formed between $106,000 and $118,000, which is far denser than the peaks of previous cycles.This means that either stronger demand will be needed to absorb the BTC sell-off, or the market will need to go through a longer and deeper accumulation phase before it can return to equilibrium.
Test proactive requirements
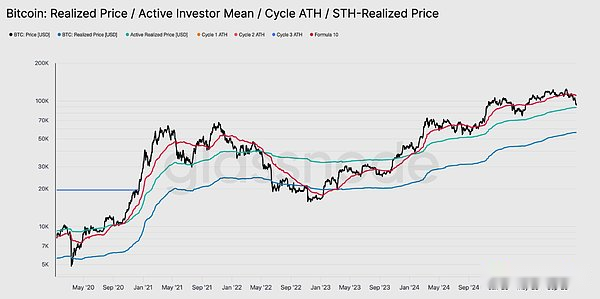
Revisiting valuation models, the market has now entered uncharted territory, with speculative interest increasing significantly during this mild bear market phase.The first major defensive area is at the Active Investors’ Realized Price, currently around $88,600.Bitcoin is trading around this price level, equivalent to the cost basis of non-dormant holders who have been actively trading in recent months, making it a potential medium-term trading range.
However, if prices fall decisively below the model, it would mark the first time this cycle that prices have fallen below active investors’ cost basis, a clear indication that bearish momentum is dominating the market.
Another form of retreat
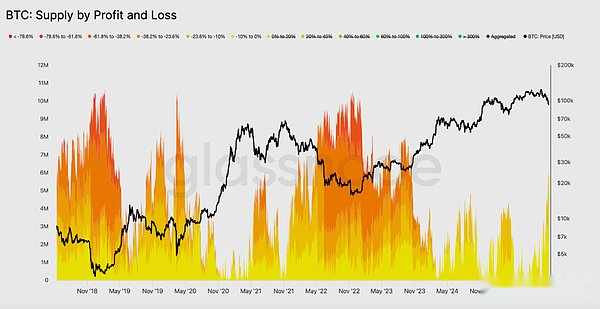
Although Bitcoin prices fell below the major lower bound of the short-term holding cost basis model, the size and extent of losses suffered by investors were nowhere near the extremes seen during the 2022-2023 bear market.The chart below tracks all cryptocurrencies currently in the red, grouped by the depth of their unrealized retracements.About 6.3 million Bitcoins are currently in the red, with most of them losing between -10% and -23.6%.
This distribution is more similar to the short-lived range-bound market in the first quarter of 2022, rather than a deep capitulation stage.
Therefore, the price range between the actual price of active investors ($88,600) and the real market average ($82,000) may be used as a dividing line to distinguish a mild bear market stage from a full bear market structure similar to 2022-2023.
Off-chain insights
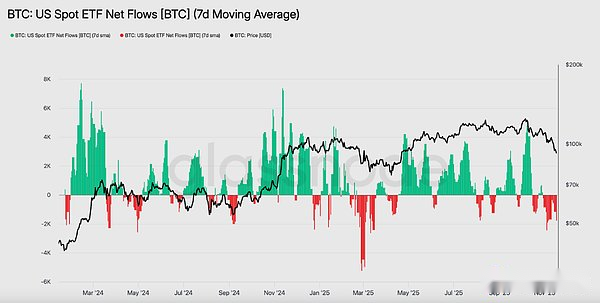
Lack of demand for ETFs
U.S. spot ETF flows continue to reflect a clear lack of demand, with the 7-day average remaining negative in recent weeks.The continued outflows signal a reluctance among traditional financial asset allocators to add to their holdings in the current downturn, a stark departure from the strong inflow patterns that have underpinned previous market gains.The continued weakness suggests that non-discretionary investment demand has cooled significantly and highlights the lack of new buying from one of the market’s largest marginal buyer groups, further reinforcing the overall constrained demand situation.The lack of continued ETF inflows indicates that an important demand pillar has not yet recovered, resulting in a lack of key demand sources in the market during this cycle.
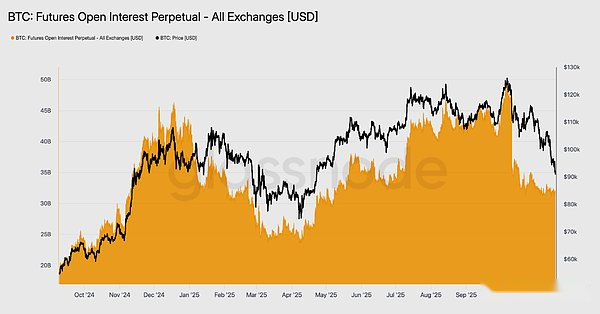
No sign of risk
Futures open interest continued to trend lower this week, falling in tandem with prices, indicating a continued decline in speculative activity.Instead of taking advantage of the dip, traders systematically liquidated their positions, resulting in derivatives market positions being significantly lower than previous declines.This lack of leverage expansion highlights the cautious attitude of market participants and is consistent with the general trend of weakening demand from risk-appetite groups.
The continued contraction in futures positioning highlights the market’s continued reluctance to deploy capital, further exacerbating the lack of confidence behind current price movements.
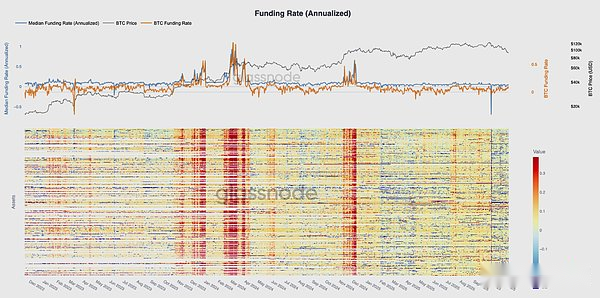
Financing interest rates are at cycle lows
Derivatives markets are signaling a clear reduction in speculative positioning as futures open interest continues to decline.Traders are closing positions rather than buying on dips, resulting in open interest leverage being significantly lower than during the previous decline.
This dynamic is also reflected in the financing market, where interest rates on the top 500 assets have clearly shifted to neutral or even negative ranges.What was previously a positive premium trend has now turned negative, highlighting a general cooling in demand for leveraged longs and the market’s shift to more defensive strategies.
The combination of falling open interest and negative financing confirms that speculative leverage is being systematically removed from the market, reinforcing risk aversion.
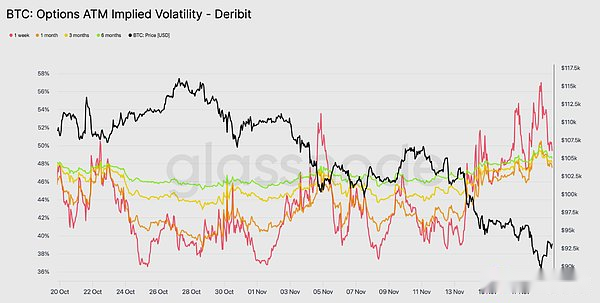
Implied volatility rises sharply
Options markets are often the first to reprice risk, and they did so quickly after Bitcoin briefly fell below $90,000.Implied volatility rose sharply across all tenors, with front-month options showing the strongest reaction.The chart shows a clear increase in short-dated options volatility, with widespread repricing across the options curve.
This growth reflects two drivers.First, there is a heightened need for downside protection as traders prepare for the possibility of a deeper pullback.Second, the reaction of the short gamma trading desk.Many traders had to buy back short options and roll their positions upward, which mechanically drove up front-month implied volatility.
Implied volatility is now close to levels seen during the Oct. 11 liquidation event, suggesting traders have quickly reassessed near-term risks.
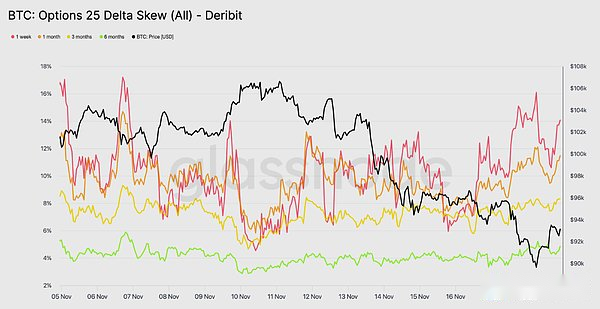
This bias confirms concerns
Moving from implied volatility to skewness, the options market sends the same message.The 25delta skewness remains negative across all tenors, with the one-week skewness approaching extremely bearish levels.The one-week put premium is around 14%, indicating that traders are willing to pay more for downside protection regardless of spot prices.
This behavior creates a self-fulfilling prophecy.When traders buy these puts, traders often end up with a short position.To hedge this risk, they sell futures or perpetual contracts.This selling behavior adds to market pressure and can amplify the weakness that traders are trying to avoid.
The yield curve for longer-dated bonds is also tilted bearish, but to a lesser extent.The yield curve for six-month bonds is just under 5%, indicating that market concerns are mainly focused on short-term bonds rather than the entire maturity range.
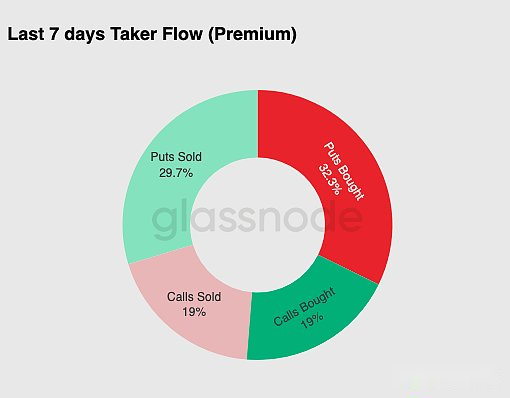
The need for downside protection
From market deviations to actual trading activity, trade flow over the past seven days has confirmed the same pattern.Traders bought large amounts of put premium, far outstripping demand for call options.This is consistent with hedging behavior, reflecting traders’ preference to protect against further market declines rather than bet on a rise.
The slump in call options trading activity is further evidence that traders are not adding significant exposure towards the end of the year.Both call buying and selling volumes have remained low compared to put flow, supporting the idea that caution, rather than speculation, is driving positioning moves.
Overall, this combination suggests the market is bracing for volatility and favoring protection over risk-taking.
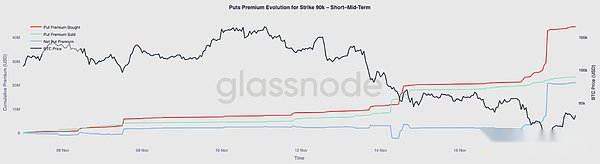
90K strike price option premium
Continuing with the overall fund flow data, the put premium at the 90K strike price shows that protective demand is accelerating as prices weaken.The net put premium on this strike remained relatively balanced over the past two weeks until Bitcoin fell below the $93,000 mark.Once that level fell below, traders increased their selling of these puts, causing option premiums at the 90K strike price to rise significantly.
This behavior suggests that traders are willing to pay higher and higher prices for downside protection as spot pressure intensifies.The move also coincides with a previous rise in short-term implied volatility, as concentrated demand at key strikes typically drives prices higher on curve front-month contracts.
The sharp repricing of the 90K puts highlights how quickly downside hedging activity accelerates when key price levels are breached.
Pricing market fragility
The DVOL Index shifts from individual option prices to a broader measure of volatility, reflecting the extent to which the market is repricing risk.The DVOL index has moved back toward monthly highs near 50 after trading near 40 three weeks ago.DVOL reflects the implied volatility of a basket of fixed-maturity options, so when the DVOL index rises, it signals that traders are expecting greater price moves in the future.
The rise ties into the overall trend in the options market.Implied volatility is rising across all tenors, skewness remains negative, deltas are negative for recent inflows, and traders appear unwilling to add risk before the end of the year.Together, these factors suggest that the market is bracing for wild price swings.Key drivers include liquidation risk in perpetual contracts, macroeconomic uncertainty, and weak spot demand due to ETF inflows.
The next event that could change this volatile pattern is the Federal Open Market Committee (FOMC) meeting in three weeks.Until then, options markets will continue to send cautious signals and express a clear preference for risk aversion.
The rise in DVOL is further evidence that the market is pricing in expectations of greater volatility ahead, and traders are bracing for market volatility.
Conclusion
Bitcoin continues to experience a challenging market phase, characterized by weakening market structures, shrinking speculative demand, and a significant increase in risk aversion in the derivatives market.
Spot demand remains sluggish, ETF inflows are negative, and the futures market has no intention of increasing leverage amid weakness.
At the same time, implied volatility, skewness, and hedging flows all suggest that investors are increasingly concerned about near-term downside risks and are paying increasingly higher premiums for protection.
All of these factors combine to create a market seeking stability, with its future direction determined by whether demand can re-emerge around key cost levels or whether current vulnerabilities will evolve into a deeper correction or bear market.