Source: On-Chain Mind, compiled by: Shaw bitchain vision
Bitcoin’s cycle is an extreme study: violent fluctuations, fanatical peaks, and inevitable adjustments.Among the many indicators that try to capture the rhythm of the market, one stands out for its incredibly accurate prediction of cycle vertices: the Pi cycle top indicator.But what if this tool, which is highly praised for its historical accuracy, is constantly evolving as the Bitcoin market matures?
In this article, we will dissect its mechanisms, explore its current signals, and introduce an enhanced adaptation approach to ensure we remain safe in a changing market environment.
Overview of key points
-
Grasp the market rhythm: The top of the Pi cycle reveals moments when short-term fanaticism goes beyond the underlying trend of Bitcoin.
-
Embrace evolution: Bitcoin’s maturity cycle shows that its peak intensity gradually weakens over time; recognizing this shift is crucial to avoid the wrong exit in an increasingly stable market.
-
Use multiple signals: There is no single “dominate indicator” that can lead the way – combine oscillation indicators with on-chain analysis, macroeconomic trends and sentiment indicators to form a comprehensive strategy.
-
Stay flexible to deal with uncertainty: Although there is a high possibility of explosive rises, situations such as steady rise or long-term consolidation also require flexible strategies to effectively respond.
Analysis of the top mechanism of Pi cycle
Bitcoin’s price cycles are not disorderly chaos; they follow a rhythmic pattern driven by human psychology, market acceptance, and economic power.At the heart of this rhythm is the top indicator of the Pi cycle, a seemingly simple tool that has won a place in the field of Bitcoin analysis.
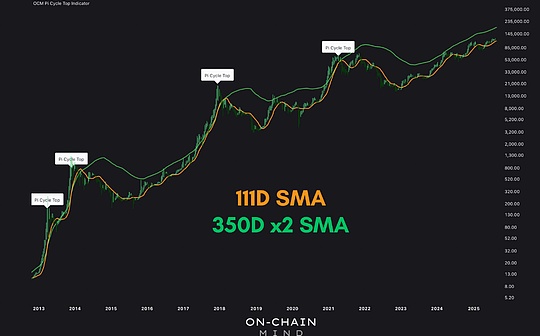
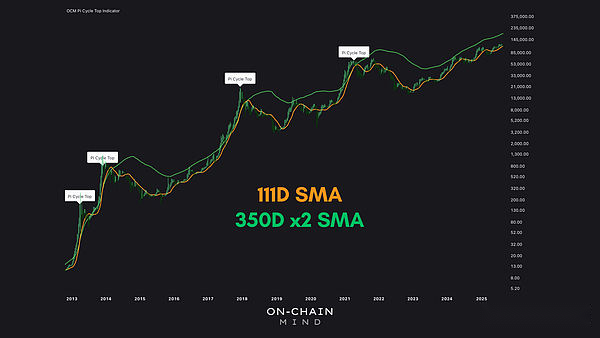
At first glance, this indicator is concise and clear.It draws two moving averages: the 111-day simple moving average (SMA) and the 350-day x2 SMA.When the shorter SMA wears the longer one, the market is usually in extreme fanaticism and historically coincides with Bitcoin’s cyclical peaks.
 The exquisite thing about “Pi periodic top” is that it can capture momentum divergence.The short-term moving average can quickly respond to recent price acceleration, reflecting the enthusiasm of traders and the “FOMO” mentality.The long-term moving average can smooth out short-term fluctuations, representing the structural normal of the market.As these averages approach, it indicates that short-term returns have far outweighed the inherent stability—a mathematical precise reflection of the fanaticism at the end of the cycle.
Historically, this metric accurately marks Bitcoin’s famous peaks every time:
-
2013: The market surged for the first time and eventually fell sharply.
-
2014: The double peaks of the cycle are perfectly presented again in just a few days.
-
2017: The price of Bitcoin is approaching $20,000, and at this time the 111-day simple moving average just crosses the 350-day double moving average.
-
2021: The intersection coincides with the on-chain peak, perfectly marking the end of the parabolic rise, followed by a rebound but eventually fell to the bottom.
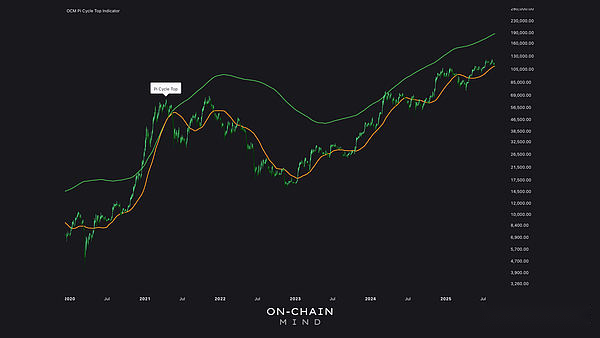
While the top of the Pi cycle provides extraordinary insight into market extremes, it is not a crystal ball that predicts the uncertainty.It confirms fanatical market conditions rather than predicting exact future peaks.Today, Bitcoin’s famous moving averages are still far apart, indicating that the historical conditions that triggered crossing—the parabolic rise of a full-blown explosion—has not yet appeared.
Limitations of classical indicators
Pi cycle tops are valuable for identifying historical cycle vertices, but it also has some limitations, which we should all understand.In the current market, the fast moving average hovers around $110,000, while the double weighted long-term moving average is around $187,000.To have traditional intersections, Bitcoin needs to rise sharply, likely to break through $200,000, which requires strong “FOMO” sentiment and near-vertical price movements from now on.
The indicator also provides a binary signal: either crossing or no crossing.This “all or nothing” characteristic may put investors at risk, and if prices begin to consolidate below the cross threshold, or the market peak gradually weakens over time—a phenomenon that becomes increasingly obvious as Bitcoin matures—it may put investors at risk.Let’s explore this concept further.
Pi cycle top oscillation index
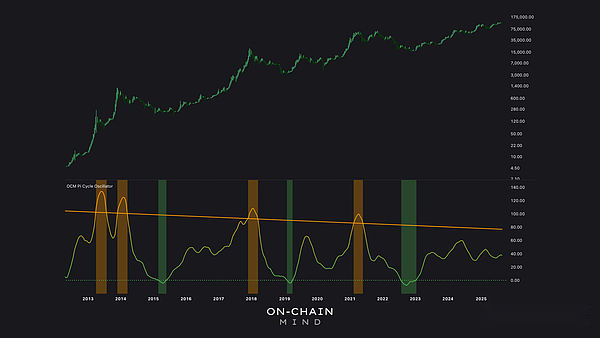
To address these limitations, the Pi cycle top oscillator transforms traditional intersections into continuous, real-time risk and cycle positioning measures.Rather than providing a single binary signal, the oscillator calculates the percentage difference between the simple moving average of 111 and 350 days × 2 and normalizes it to readable values.
-
Orange appears when the moving average convergesBackground, this historically heralds the top.
-
greenHighlighting is the period when the mean is significantly different and is aligned with the bottom.
 This continuous scale indicator has many advantages over traditional indicators.It allows us to monitor risks in real time and adjust positions gradually, rather than waiting for the intersection of “all or nothing”.It also captures the decreasing intensity of the periodic peak intensity, as each new cycle may not reach the same extreme value as the previous cycle.
Relatively speaking, the peak value of each cycle gradually decreases.The following are the peak oscillation indicator readings:
-
2013/14 Cycle:130
-
2017 Cycle:110
-
2021 cycle:100
Bitcoin’s ever-changing market structure means that just waiting for the classic intersection can miss out on opportunities or delay exit.Therefore, a more flexible approach is needed.
Currently, the oscillation index reads about 37, which is much lower than historically related to the top of the cycle.This shows thatAlthough Bitcoin experienced a strong bull market in early 2024 and early 2025, the market has not yet entered the end-of-cycle fanatic phase that usually appears before the top.By tracking the oscillation indicator, for those who wish to make a profit in this cycle, gradually close positions when the indicator reads close to 75 or higherPerhaps a wise choice.
Limitations and future prospects
Although the oscillation indicator provides better precision than traditional indicators, it is not without flaws.And it all depends on two main assumptions:
-
As Bitcoin gradually matures, its price peak continues to decline;
-
The cycle ends with a parabolic ending.
The former seems likely, but the latter is up for discussion.Can this round of market avoid the peak and peak, and instead be driven by continuous institutional buying rather than retail speculation, achieving a gradual rise?
certainly.This long-term slow rise in step-by-step manner may continue, and then enthusiasm fades without a significant decline.In this case, the oscillation indicator will almost certainly perform poorly, as it relies on a vertical rise to boost the reading.Because of this, it is crucial to reduce the risk of these single indicators by integrating multi-faceted on-chain analysis tools and other macro signals.
I intend to look at this “slow decline” scenario and the potential impact it may have on our portfolio during this cycle, because nothing is absolutely absolute.Just because we have experienced a soaring top driven by the “FOMO” psychology in each cycle before, it does not mean that it will happen again this time.
But personally, I fully agree with the view that history will not repeat itself, but there will always be similar rhythms.In a market like Bitcoin with severe volatility and complex psychological factors, I certainly tend to think that there will be a decisive rebound at some point.But no one can tell when it will happen.


