
Current inflation trends
In November 2025, the U.S. economy faces a complex situation with inflation trends.According to the latest Consumer Price Index (CPI) data released by the U.S. Bureau of Labor Statistics (BLS), as of September 2025, CPI increased by 3.0% year-on-year, a slight acceleration from 2.9% in August, indicating that inflationary pressure has picked up in the short term.However, the Fed’s preferred Personal Consumption Expenditures (PCE) price index showed that core PCE (excluding food and energy) rose 2.9% year-on-year, still above the long-term target of 2%, but the overall trend has slowed significantly since the peak in 2022.Experts are sharply divided: some economists believe inflation is cooling, benefiting from stable energy prices and improved supply chains; others warn that potential tariff barriers and labor market resilience could cause inflation to heat up.
Analysis shows that although inflation is showing signs of cooling, structural risks cannot be ignored and may push up price levels in 2026.Based on the latest economic indicators, this article analyzes the cooling and heating signals of inflation, explores the difference between nominal and real growth, and evaluates what will be the impact if the actual inflation rate is twice the official data?
Durable goods orders: Signal of strong manufacturing demand
Durable goods orders are a key measure of manufacturing investment and consumer demand for durable goods.In September 2025, U.S. durable goods orders increased by 0.5% month-on-month, higher than market expectations of 0.2%; core durable goods orders (excluding defense and aerospace) increased by 0.1% month-on-month, exceeding expectations of -0.1%.According to Census Bureau data, the increase was mainly due to a rebound in orders for machinery equipment and computers, reflecting the increased willingness of businesses to spend capital.
To assess annual trends, annualized growth rates can be approximated by multiplying monthly data by 12 and applying a 12-month moving average.As of September 2025, the annualized growth rate of durable goods is approximately 10.2%, and core durable goods (excluding national defense) is 8.8%.This level is significantly higher than the historical average after the 2008 financial crisis (about 5%-6%), indicating strong manufacturing demand.The International Monetary Fund (IMF) pointed out in its October 2025 report that such indicators indicate that U.S. economic growth may remain above 2.5%, but also heighten concerns about inflation, as demand pulls are often accompanied by rising prices.
Expert comment: Raphael Bostic, president of the Federal Reserve’s Atlanta branch, emphasized in a speech on November 12, 2025 that the rebound in durable goods orders “strengthens the risk of upward inflation” because it may amplify the bottleneck effect of the supply chain.In contrast, JPMorgan economists believe that this is more of a “temporary phenomenon of inventory rebuilding” and will not significantly push up core inflation.
Retail sales: real weakness amid nominal boom
Retail sales data reveal a dual face of consumer spending.In September 2025, nominal retail sales increased by 0.2% month-on-month, reaching an annualized rate of 4.3%, close to the peak after 2008, benefiting from early consumption during the holiday season and demand for electronic products.According to preliminary data released by the Census Bureau on November 25, total retail sales rose 5.1% from the same period a year ago, and core sales (excluding automobiles and gasoline) rose 5.3%.
However, nominal data tend to be overestimated because they are not adjusted for inflation.Adjusted real retail sales (using the PCE price index) increased by only 1.3%, which was in the low range since 2008.Since April 2022, real growth has been continuously negative until the end of 2024, when it turned positive, but the extent was limited.This highlights the misleading nature of nominal indicators: mainstream media often report nominal growth of 4%-6%, but ignore the purchasing power erosion of inflation.
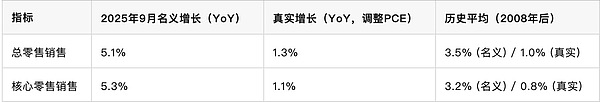
Data source: U.S. Census Bureau, November 2025 report.
Circana Consulting stated in a report on November 14, 2025 that “consumer resilience is reflected in nominal spending, but unit demand fell by 3%, indicating price fatigue.”Yale University economist Mike Green added in a recent article that the new poverty line has risen to an annual income of $150,000 to $160,000, and inflation has “destroyed the purchasing power of the middle class.”This contrasts with official data and underscores the need to view economic health through a real lens.
Producer Price Index (PPI): Pressure transmission on the production side
The Producer Price Index (PPI) is a forward indicator of consumer inflation, capturing price changes at the wholesale level.In September 2025, PPI increased by 2.7% year-on-year, and core PPI (excluding food, energy and trade services) was 2.6%.Both are close to 3%, above the Fed’s 2% target and up from 2.4% in August.An 11.8% increase in gasoline prices was the main driver, but processed food and metal prices also contributed 0.5%, according to the Bureau of Labor Statistics.
The cumulative index of PPI (orange line) shows that price levels have continued to rise since 2020 and have rarely fallen back during non-recession periods.This is consistent with consumer perception: although the year-on-year rate has slowed down, the cumulative increase has reached more than 20%.The BLS report pointed out that PPI is 4-6 months ahead of CPI, and pressure from the production side will gradually be transmitted to retail sales.
RBC Economic Research warned in an analysis on October 17, 2025 that the rebound in PPI “foreseen CPI to exceed 3% in the second half of the year,” partly due to the lagging effect of services such as housing rentals.Goldman Sachs economists are cautiously optimistic, believing that stable energy prices will inhibit transmission, but tariff policies may amplify imported inflation.
ISM Manufacturing PMI Price Index: A ‘clock’ for inflation forecasts
The price sub-index of the ISM Manufacturing Purchasing Managers’ Index (PMI) is a leading indicator of inflation.By pushing the index forward three months, the PPI trend can be predicted.In October 2025, the ISM price index was 58%, down 3.9 percentage points from 61.9% in September, but still higher than 50, indicating that raw material prices have increased for 13 consecutive months.The index has been trending upward since the beginning of 2023, indicating that PPI will accelerate in early 2026.
The ISM report shows that industries with rising prices include clothing, electronic components and steel, with 14 industries reporting “price increases”.Supply chain executives report that tariffs and geopolitical tensions are exacerbating cost pressures.The lag effect of this indicator: ISM leads PPI by 3 months, and PPI leads CPI by 4-6 months, forming a complete transmission chain.
Susan Spence, chair of the ISM Manufacturing Business Survey Committee, said in a report on November 3, 2025, “The fall in the price index is a positive sign, but the contraction in demand (PMI overall 48.7) suggests that the economic slowdown may suppress inflation.”Economists at Deloitte Consulting added that this “clock” model is 85% accurate, but uncertainties in 2025 (such as trade wars) may distort the forecast.
PCE per capita: The controversy over alternative inflation measures
The Fed’s preferred PCE index provides a more comprehensive view of consumption.In August 2025, total PCE reached US$20.1 trillion, and the core PCE price index increased by 2.9% year-on-year.To capture the per capita impact, PCE is divided by the labor force population (the participation rate in September 2025 is 62.4%, approximately 165 million people), and the per capita PCE is approximately US$121,800 per year.
Compared with the per capita figure of US$90,000 in January 2020 (before the epidemic), the cumulative increase in five years was 38%.The annualized growth rate is 3.2%, and the five-year moving average is 5.9%, which is close to 6% – nearly twice the cumulative CPI of 20%.This measure directly reflects actual consumer spending, unadjusted for volume (i.e. it may overestimate inflation if more units are purchased), but more closely approximates the cost of living.
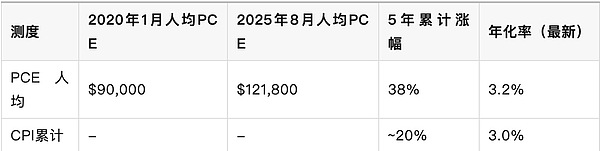
Data source: BEA, September 2025 report; labor force data from BLS.
St. Louis Fed economist Fernando M. Martin pointed out in an article on October 17, 2025 that the PCE per capita “captures health care and housing expenditures that the official index ignores”, supporting the view of “a higher-than-target inflation regime.”The Cleveland Fed’s current casting model shows that PCE inflation may stabilize at 2.7% by the end of 2025, but if tariffs intensify, it could rise to 3.5%.Critics, such as researchers at the Brookings Institution, argue that this measure ignores volume adjustments and underestimates efficiency gains.
Is inflation cooling or heating up?Expert disagreement and risk assessment
Comprehensive indicators show mixed signals of cooling mixed with warming.CPI and PCE have continued to fall since their peaks in 2022 (CPI 9.1%, PCE 7.0%), but there are obvious signs of acceleration in the third quarter of 2025: energy price fluctuations and the lagging effect of housing rents have pushed up core indicators.The IMF forecast in October 2025 that U.S. median inflation would be 2.8% in 2025 and fall to 2.4% in 2026, but warned that trade barriers could reverse the trend.
Optimists: Fed Governor Christopher Waller said in November 2025 that “core prices have annualized only 2.4% over the past six months and will cool further if there is no major shock.”Morgan Stanley economists expect a cooling labor market (unemployment rate 4.3%) to curb the wage-price spiral.
Pessimist: Atlanta Fed Bostic warned that “inflation has exceeded target for nearly five years, tariffs have contributed 30 basis points, and price increases are expected to remain unchanged in 2026.”RBC economists predict that CPI will exceed 3% in the second half of the year as the leading indicator of owner-equivalent rent (OER) rises.The United Nations report stressed that protectionist policies could reignite global inflation.
Geographical risks: The Russia-Ukraine conflict and tensions in the Middle East have pushed up commodities, and the commodity index in the PPI has been rising step by step in the past five years.EY-Parthenon predicts that holiday retail sales will grow by 2.5% in nominal terms in 2025, but the real volume will remain flat, driven mainly by price.
Scenario analysis: If the actual inflation rate is twice the official
Assuming actual inflation is twice the official (CPI 3.0%), or 6%, this will amplify economic pressure.Based on the evidence that PCE per capita has averaged 5.9% over the past five years, this scenario is not far-fetched: the cumulative price increase will reach 40%, eroding the purchasing power of the middle class.The new poverty line has risen to US$160,000, and real retail sales may have a negative growth of 2%, triggering a contraction in consumption.
Impact: The Federal Reserve may accelerate interest rate hikes, with the federal funds rate rising to above 5%, suppressing GDP growth to below 1.5%.Business costs surge, PPI transmission accelerates, and the ISM price index may exceed 65.Consumer perception: An increase in the cumulative index will exacerbate dissatisfaction, similar to the “deflation” dilemma in 2022 – economic growth but the cost of living soars.Mitigation path: If the volume adjustment takes effect (consumers switch to cheaper alternatives), the actual impact can be mitigated to 4%, but policy intervention such as subsidies is required.
Goldman Sachs simulated in its November 2025 report that under this scenario “the probability of a soft landing drops to 40%” and called for fiscal restraint.On the contrary, optimists such as TD Economic Research believe that AI productivity improvements can offset some of the pressure.
Conclusion: The need to balance risks
US inflation is at a crossroads: Durable goods and retail sales data point to demand resilience, PPI and ISM signal transmission risks, and PCE per capita reveals an underestimation in official data.Cooling signs (e.g. energy stability) dominate, but heating factors (tariffs, housing) cannot be ignored.CPI may hit 3% at the end of 2025, and it depends on policies in 2026.
The Fed should maintain its gradual rate cuts while monitoring alternative measures.Companies need to optimize supply chains, and consumers turn to real indicators for decision-making.Ultimately, inflation management requires a comprehensive perspective to avoid the illusion of nominal prosperity.Future data (such as December CPI) will further clarify the direction, but structural reforms are the long-term key.


