Author: Naly Source: moneyverse Translation: Shan Oppa, Bitcoin Vision
The year 2025 for Ethereum is not glamorous, but mature and steady.
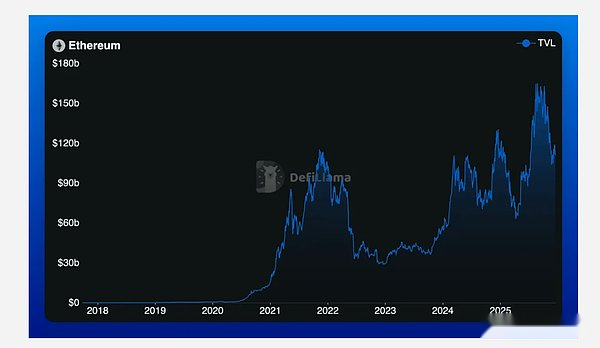
Its total locked-up value was finally fixed at approximately US$68.8 billion, a slight decrease of more than 7% year-on-year.In previous cycles, based on this data alone, the argument that “Ethereum is declining” would have been rampant.But this time, that argument didn’t resonate — because it ignored where the real change was.
The balance sheet heat has cooled, but the network engine is getting stronger.In 2025, the Ethereum network will generate more than $4 billion in fees, an increase of more than 45% from 2024.This departure is precisely the core narrative of this year: ecological maturity driven by efficiency.
Application-led pattern
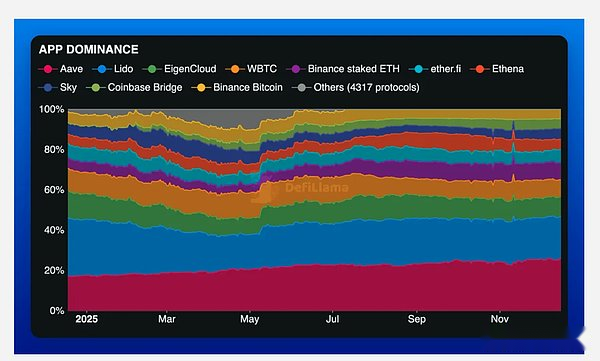
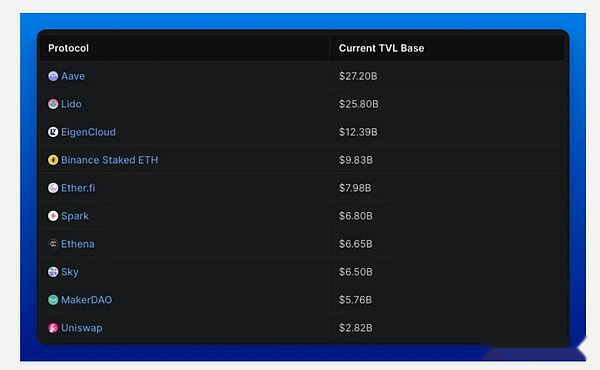
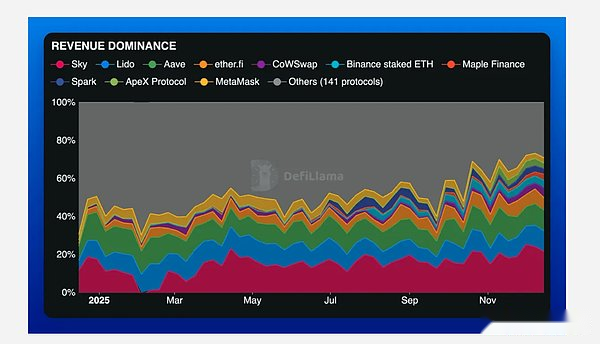
Currently, a handful of protocols form the cornerstone of Ethereum’s balance sheet.
Aave is still the core of gravity in the DeFi field, accounting for more than 26% of the total locked value of the entire network.Followed closely by Lido (accounting for just over 20%), and EigenLayer, which has quietly grown to about 10% through re-staking.These three major protocols alone account for more than half of the deployment capital of the Ethereum network.
Outside of them, although other protocols still have a certain degree of financial depth, their levels are clearly differentiated.Binance’s staking ETH product, EtherFi, Ethena, Sky, Spark and Uniswap constitute the second tier of liquidity – relevant and active, but no longer a force shaping the core focus of the ecosystem.
This is industry consolidation in a real sense: capital is tending to choose familiarity, trust, and inherent distribution channels rather than blindly chasing innovative experiments.
Handling fee performance
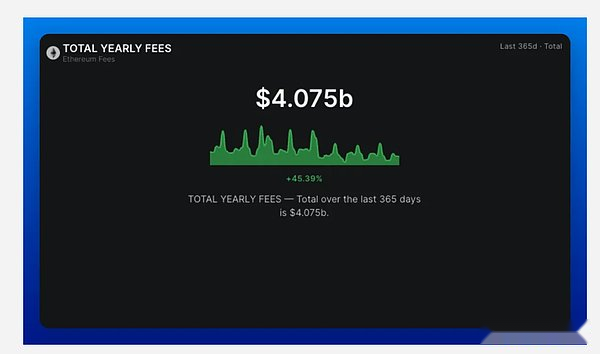
Despite the contraction in total value locked (TVL), Ethereum still generated more than $4 billion in fees this year, a year-on-year increase of 45%.This divergence is the most defining feature of 2025.
The amount of capital held in Ethereum (or at least the value in USD terms) has decreased, but the efficiency of monetizing network activity has increased significantly.The network is realizing more value with less capital, which signals that the entire system is moving from speculative expansion to sustainable use.
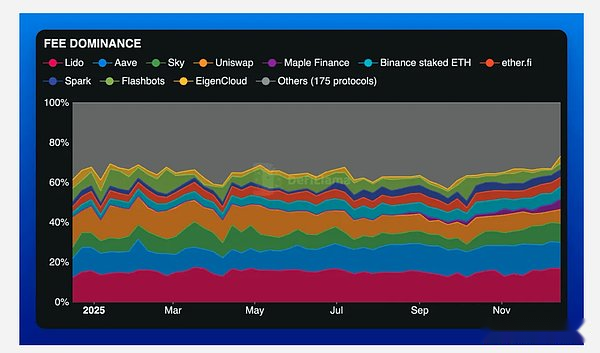
Three major protocols dominate the fee ecosystem: Lido accounts for approximately 17% of Ethereum’s total fees, followed by Aave at 13%, and Sky contributes nearly 10%.The three together create nearly 40% of the economic throughput of the entire network.
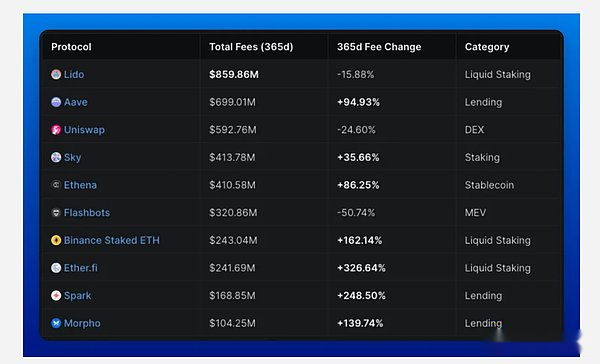
However, even within this dominant landscape, changes are still visible.Although Lido and Uniswap still rank at the top of the cumulative fee rankings, their year-on-year fee growth has slowed or even declined.Market share has not collapsed, but it is being gradually eroded by faster-moving competitors.
Agreement income
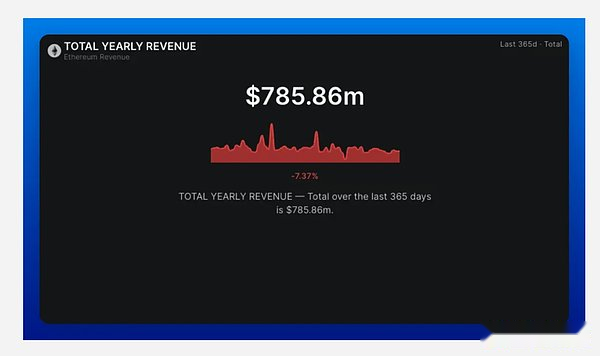
If the handling fees are stripped down to the level of actual agreement income, the industry ranking will change.Ethereum’s total application protocol revenue for the year was approximately $786 million, a slight decrease year-on-year.The gap between fee expenditures and protocol revenue reflects the fact that more and more revenue is going to validators or being burned rather than being credited to the protocol treasury.
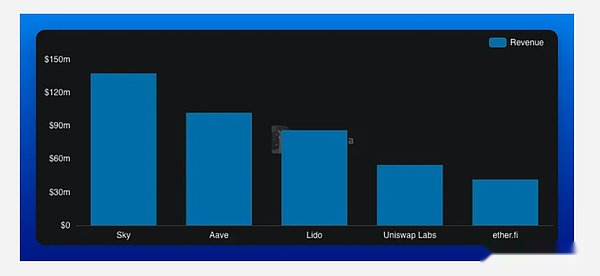
In this relatively narrow revenue pie, Sky stands out as the most eye-catching monetization engine.It accounted for about 22% of total protocol revenue for the year, far more than Aave and Lido (both at about 11%).
Sky’s revenue of $137 million dwarfed Aave’s $92 million and Lido’s $86 million.The gap between first and second place is clear and reflects Sky’s business model being better at extracting value from network activity rather than just hosting it.
Decentralized exchange dominance
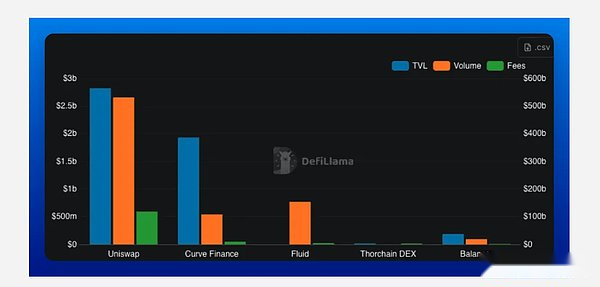
Uniswap is still the king of swaps.At the end of the year, its total locked-up value was approximately US$2.8 billion, its cumulative trading volume exceeded US$2 trillion, and its fee income was nearly US$600 million.Its V3 architecture continues to define capital efficiency for automated market makers (AMMs).But its dominance is eroding.
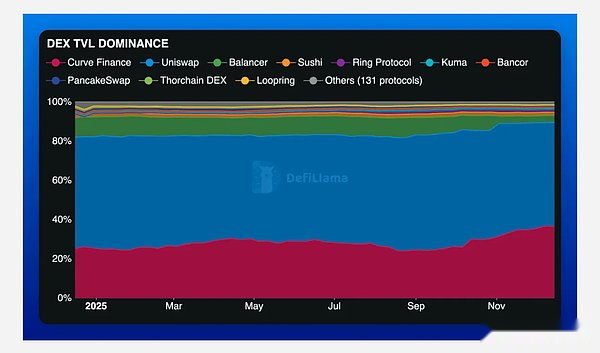
Uniswap still controls just over half of the total value locked on DEX, but Curve has had one of the quietest recoveries of the year — climbing from 25% to over 36% of the market.Focusing on the return of liquidity demand for stablecoins, Curve has once again become a force that cannot be ignored in the ecosystem.
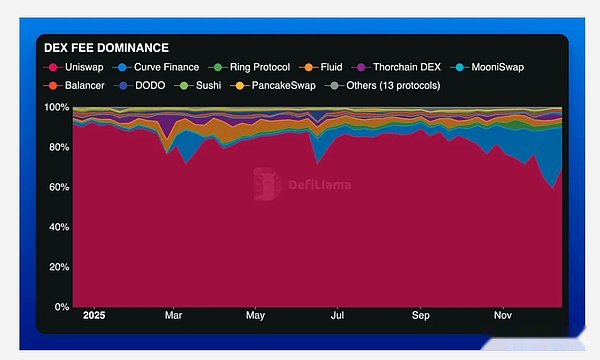
Even more disruptive, however, was the rise of Fluid.Despite the lack of traditional total value locked (TVL) statistics in many data aggregation platforms, Fluid has captured a significant share of trading volume and fees.Today, it ranks second in both DEX trading volume and fee revenue, earning more than $140 million in fees with over $300 billion in trading volume.

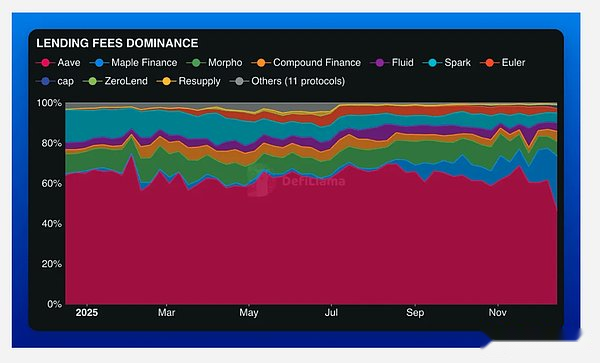
This year, Uniswap’s DEX trading volume has dropped from nearly 70% to less than 50%, and its handling fee dominance has dropped from more than 90% to less than 70%.At the same time, Curve’s fee share has soared from negligible to more than 20%.
This is not a collapse, but a manifestation of market fragmentation.The quality of trade execution, routing efficiency and scenario specialization are starting to influence the competitive landscape more than the brand itself.
Judging from the ratio of market capitalization to total locked value, Curve and Balancer are at industry lows.Both protocols have deep and stable liquidity relative to their respective market caps, meaning the market is skeptical about the long-term defensiveness of their fee streams.
The recovery of Curve’s fee share this year proves that it still has important economic value, and also reflects the rapid migration of DEX liquidity when the incentive mechanism or execution quality changes.

Uniswap is in a different valuation system.Despite losing some volume and fee dominance throughout the year, it remains one of the assets with the most attractive price-to-fee ratio in the industry.
This deviation in valuation and performance is significant: it shows that even as competitive pressure intensifies, the market is still willing to endorse Uniswap’s cash flow generation capabilities, effectively treating it as ecological infrastructure rather than a growth asset.In other words, Uniswap is no longer priced like a speculative AMM and closer to the underlying components of a mature exchange.
Dominance in the field of lending
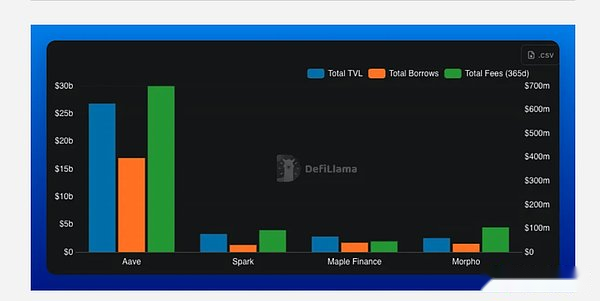
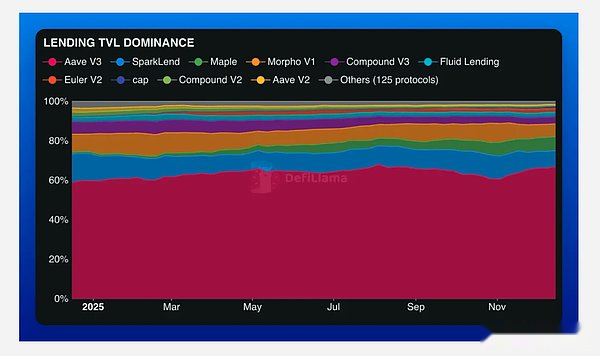
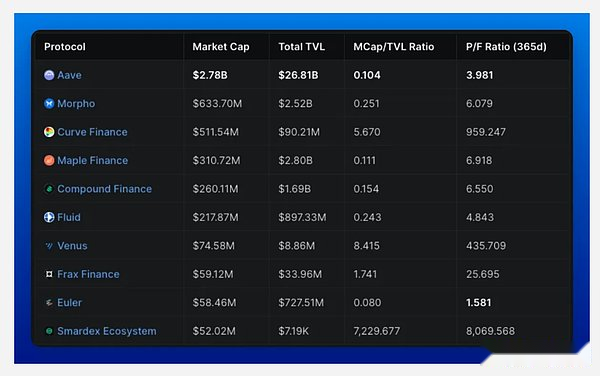
If the DEX market is fragmenting, the lending space is showing the opposite trend.Aave is the undisputed leader in on-chain credit – its total locked-up value is approximately 8 times that of its nearest competitor, and its fee income is nearly 7 times that of its nearest competitor.In a space where trust, liquidity depth and risk management are critical, Aave has few rivals.
Its dominant position further expanded this year: the total value locked in the lending field increased from approximately 61% to more than 67%.Spark’s share shrank and Morpho stagnated, but Maple experienced explosive growth — climbing from less than 1% to over 7% market share, driven by institutional adoption and private credit demand.
The proportion of handling fees is similar, but there is a twist: Aave still accounts for nearly half of the loan handling fees, but Maple has taken over 21% of the share, directly entering Aave’s territory.The market does not abandon leaders, but selectively builds new ecosystems around them.
As the core pillar of the Ethereum credit system, Aave’s price-to-fee ratio (P/F) remains relatively conservative.Euler is the only exception, with a lower P/F ratio, despite being only a fraction of Aave’s size and depth of liquidity.
LST dominance
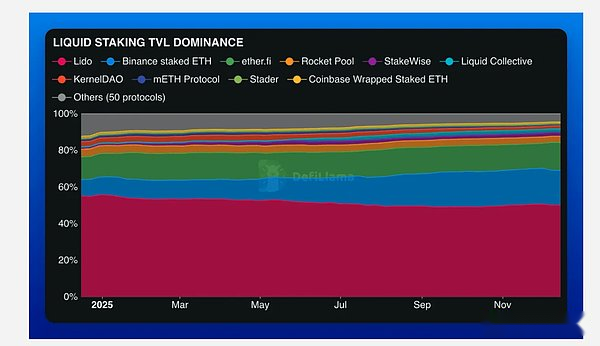
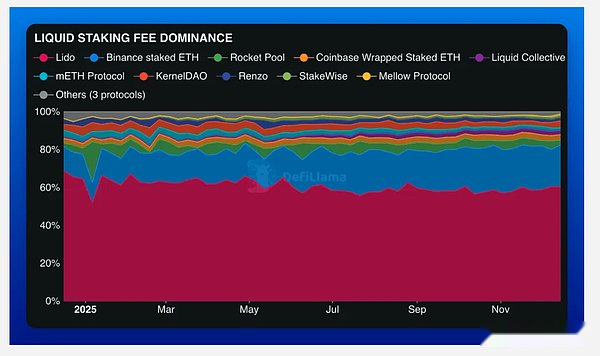
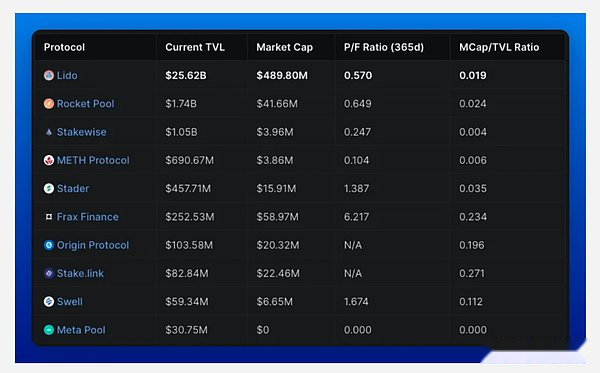
Lido remains a giant in the field.With a total locked-up value of over US$25 billion, it holds more than twice the capital of Binance’s ETH-staking product, and has won the “triple crown” in the LST field: the highest total locked-up value, the highest handling fees, and the highest income.But its competitive moat is narrowing.
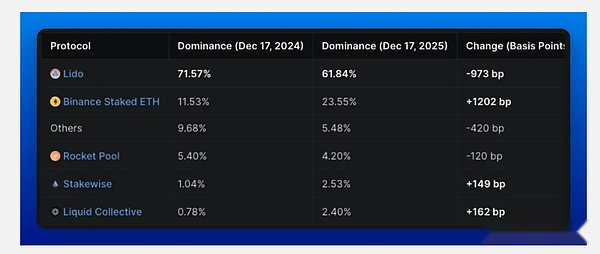
Lido has lost nearly 10 percentage points of market share over the past year, while Binance’s share of staked ETH has grown by more than 12 percentage points, climbing to about 23.5%.The distribution channels of centralized exchanges have made a strong comeback with remarkable results.
Lido’s fee dominance remains highly volatile, fluctuating between 60% and 75% with ETH price and network activity; in contrast, Binance’s fee share shows stable linear growth.The difference between the two lies not in product quality, but in distribution capabilities.
Despite its strategic significance, the trading performance of the LST token shows that the market does not view it as a cash flow yielding asset.The ratio of market capitalization to total value locked across the industry is at a low level, and even compared to other DeFi verticals, Lido’s relative premium is not obvious – this is mainly because most LST tokens are structured as governance and utility tools rather than revenue-sharing rights.
In short, the staking layer can create a lot of fees, but token holders often cannot directly obtain these benefits.Unless control over monetization is achieved through a clear value accumulation mechanism, clearer buyback rules, or through trusted governance, the market will still view the LST token more as an “access key” to the protocol than a certificate of ownership of the economic engine.
There is a deeper structural reason for this valuation discount: LST’s fees and revenue depend almost entirely on the underlying assets it tracks.When ETH price increases, staking revenue increases; when ETH network activity slows, staking revenue decreases.This makes LST’s economic performance highly correlated with the underlying assets, rather than stemming from any unique protocol alpha.
For users, this leads to a simple question: Why hold riskier governance or utility tokens with no direct claim to cash flow when holding ETH itself more directly captures the same upside potential?Unless the LST token can clearly decouple its value from the price movement of the underlying asset, or provide differentiated benefits beyond passive correlation, this trade-off will continue to limit how the market values it.
kingmaker
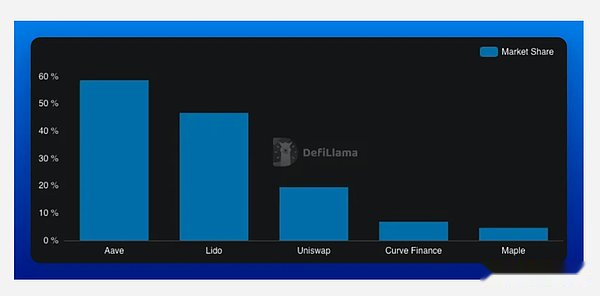
The people behind the scenes not only hold assets, but also drive core economic activities in their fields.
-
Aave accounts for 58.65% of the lending share in the DeFi space ($21.26 billion) and is the ecosystem’s main source of credit;
-
Lido occupies a dominant position of 46.69% ($25.74 billion) in the total value of liquid pledged positions and is the cornerstone of liquidity for pledged ETH;
-
Uniswap captures 20.75% of total DEX trading volume ($2.53 billion in daily trading volume) and remains the most actively traded platform in DeFi.
Data shows that Aave and Lido have achieved “significant growth” in their respective fields, controlling nearly half or more of the market share.However, Uniswap’s volume-total-value-locked efficiency, Maple’s capture of institutional lending, and Curve’s return to control of stablecoin liquidity all point to the same trend: market share is increasingly being won through specialized functionality rather than relying solely on passive asset accumulation.
What does 2025 really reveal about Ethereum?
Ethereum in 2025 isn’t getting louder, it’s getting tighter.The total value locked is cooling, fees are soaring, and power is concentrated—the network is moving from speculative and disorderly expansion to something even harder to fake: economic density.
Aave, Lido, and Uniswap remain at the core of the ecosystem and are the default choices for credit, staking, and price discovery.But changes at the edge of the ecosystem are where the signals are: Curve regains the gravity of the stablecoin field, Fluid attracts capital flows with a different architecture, and Maple proves that there is a real demand for on-chain credit in non-2021 DeFi models.
In Ethereum in 2025, the core narrative is no longer about attracting capital, but about allowing existing capital to generate returns.