Author: CryptoVizArt, Chris Beamish, Antoine Colpaert,; Source: Glassnode
Summary
-
Bitcoin is stabilizing above the True Market Mean, but the broader market structure now resembles Q1 2022, with over 25% of supply in the red.
-
Capital momentum remains positive, supporting consolidation, albeit well below mid-2025 peaks.
-
The 0.75–0.85 quantile range ($96.1K–$106K) is a key area to restore market structure; a break below will increase downside risks.
-
ETF fund flows turned negative and spot cumulative volume difference (CVD) fell back, indicating weakening demand.
-
Futures open interest fell and funding rates reset to neutral, reflecting a risk-off stance.
-
The options market is characterized by compression of implied volatility (IV) and softening of skew, with capital flows shifting from put options to cautious call option selling.
-
Options appear to be undervalued, with realized volatility exceeding implied volatility, putting pressure on short-gamma traders.
Overall, markets remain fragile and rely on being able to hold on to key cost base areas unless macro shocks tip the balance.
On-chain insights
Bottoming or collapse?
Over the past two weeks, Bitcoin prices have fallen and found support near a key valuation anchor known as the True Market Mean – the cost basis for all non-dormant coins (excluding miners).This level typically marks the dividing line between a mildly bearish phase and a deep bear market.While prices have recently stabilized above that threshold, the broader market structure is increasingly echoing the dynamics of Q1 2022.
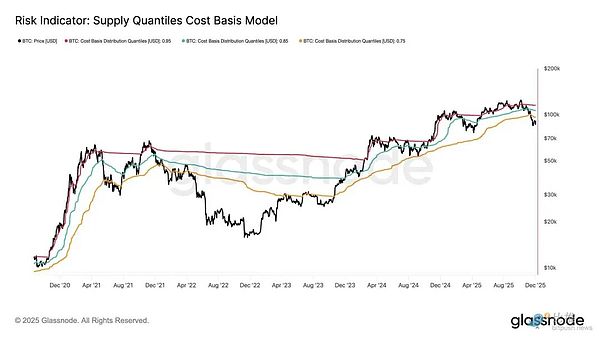
This similarity becomes clearer using the Supply Quantiles Cost Basis Model, which tracks the cost basis of supply clusters held by top buyers.Spot prices have fallen below the 0.75 percentile since mid-November and are currently trading around $96.1K, leaving over 25% of the supply at a loss.
This creates a fragile balance between the risk of top buyer capitulation and the potential for seller exhaustion to form a bottom.However, the current structure remains highly sensitive to macro shocks until the market is able to recapture the 0.85 quantile (~$106.2K) as support.
pain dominates
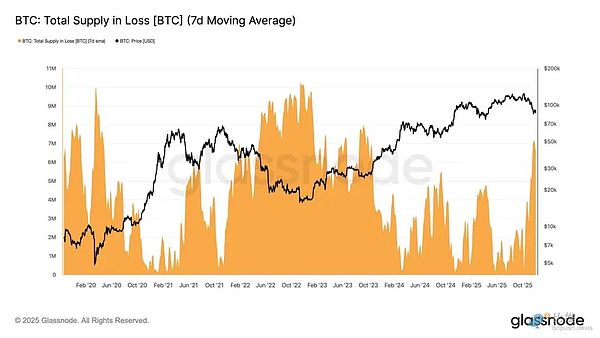
Based on this structural view, we can zoom in and observe the supply situation of top buyers through “Total Supply in Loss” to measure the dominance of losses, that is, unrealized pain.
The indicator’s 7-day simple moving average (7D-SMA) climbed to 7.1 million BTC last week — its highest level since September 2023 — highlighting that the two-plus-year bull market price expansion is now facing two shallow bottom-making phases.
The size of the current loss-making supply (between 5 million and 7 million BTC) is strikingly similar to the sideways market in early 2022, further reinforcing the above similarity.This comparison once again emphasizes that the true market mean is the key threshold that distinguishes mild bearish phases from the transition to a more definite bear market.
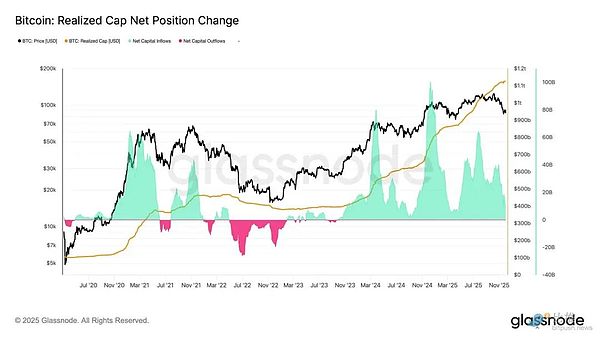
Kinetic energy is still positive
Despite strong similarities to Q1 2022, capital momentum into Bitcoin remains slightly positive, which helps explain support near the real market mean and subsequent recovery above $90K.
This capital momentum can be measured by Net Change in Realized Cap, which currently stands at +$8.69 billion per month – well below the July 2025 peak of $64.3 billion per month, but still positive.
As long as capital momentum remains above zero, the real market average can continue to serve as a consolidation zone and potential bottoming area, rather than the beginning of a deeper decline.
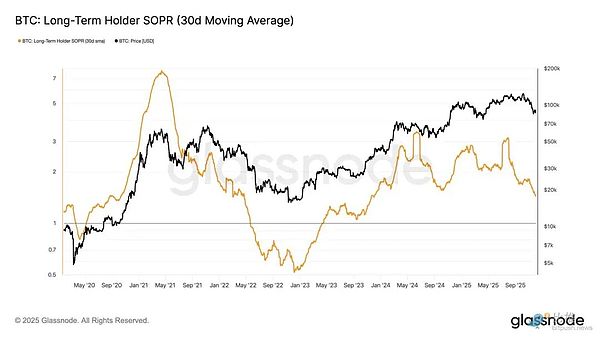
Long-term holder profit margins fade
Remaining in a regime of positive capital inflows means that new demand can still absorb profit-taking by long-term investors.Long holders SOPR (30D-SMA, a measure of spot price to cost basis for actively spending long holders) fell sharply along with the price but remains above 1 (currently at 1.43).This emerging margin trend once again echoes the structure of Q1 2022: Long-term holders continue to sell on earnings, but margins are shrinking.
While demand momentum is stronger than it was at the start of 2022, liquidity continues to be low, making it imperative for bulls to hold on above the true market mean until a new wave of demand enters the market.
Off-chain insights
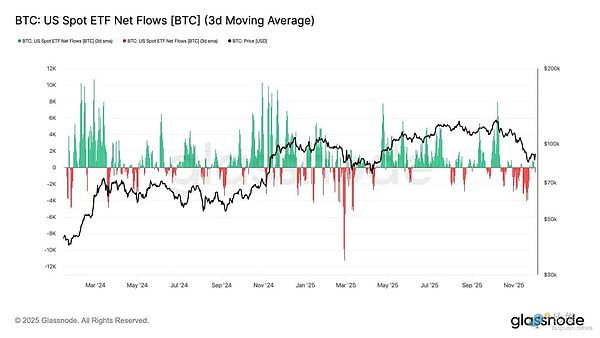
ETF demand weakens
Turning to the spot market, net inflows into the U.S. Bitcoin ETF worsened significantly, with its 3-day average sliding firmly into negative territory throughout November.This marks a break from the sustained inflows that supported prices earlier this year and reflects a cooling of new capital allocations.
Outflows were broadly spread across issuers, indicating a more cautious stance by institutional players as market conditions weaken.The spot market currently faces a backdrop of weakening demand, which weakens immediate buyer support and makes prices more sensitive to external shocks and macro-driven swings.
Spot buying weakens
Building on the worsening demand for ETFs, cumulative volume difference (CVD) has also retreated on major exchanges, with both Binance and aggregation trading platforms continuing to trend negative.
This indicates a steady increase in sell pressure driven by takers, with traders crossing the bid-ask spread in order to reduce risk rather than accumulate.Even Coinbase, often seen as a bellwether for U.S. buying strength, has been flat, pointing to a general retreat in belief on the spot side.
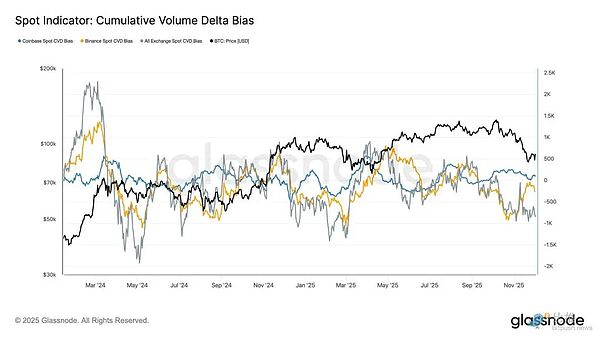
With ETF flows and spot CVD bias turning defensive, the market now relies on a weaker demand base, leaving prices more vulnerable to continued declines and macro-driven volatility.
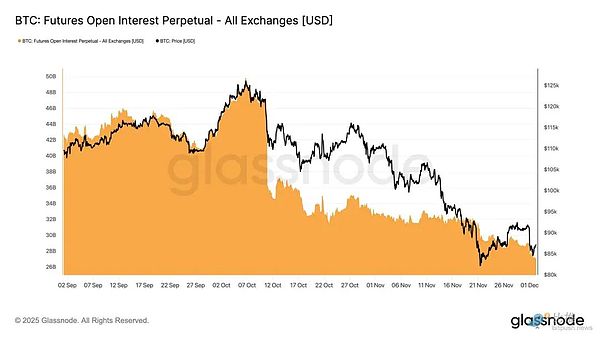
Open interest continues to decline
Extending this weakening demand trend into derivatives markets, futures open interest continued to decline steadily in late November.While the unwind was smooth, it was sustained, erasing much of the speculative positioning accumulated during the previous uptrend.With no meaningful new leverage entering the market, traders appear reluctant to express directional beliefs, preferring instead to take a conservative, risk-averse stance on lower prices.
The derivatives complex is now significantly less leveraged, signaling a clear lack of speculative appetite and reducing the likelihood of sharp liquidation-driven volatility.
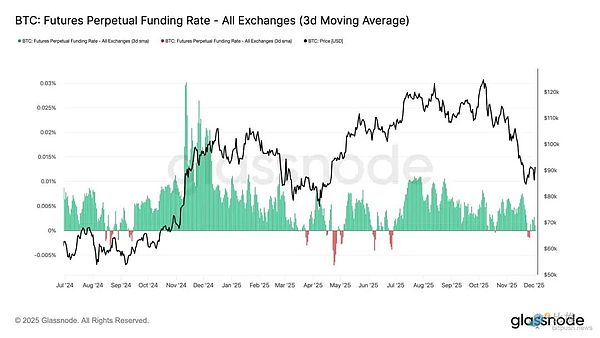
Neutral funding rate marks reset
As open interest continues to shrink, perpetual funding rates have cooled to roughly neutral territory, fluctuating around zero for much of late November.This marks a clear shift from the high positive funding rates observed during previous expansions and suggests that excess long positions have largely been unwound.Importantly, the period of mild negative funding rates remained brief and short-lived, indicating that traders were not actively building short positions despite the price decline.
This neutral to slightly negative funding mix suggests a more balanced derivatives market and a lack of crowded long positions, reducing downside vulnerability and potentially setting the stage for more constructive positioning as demand begins to stabilize.
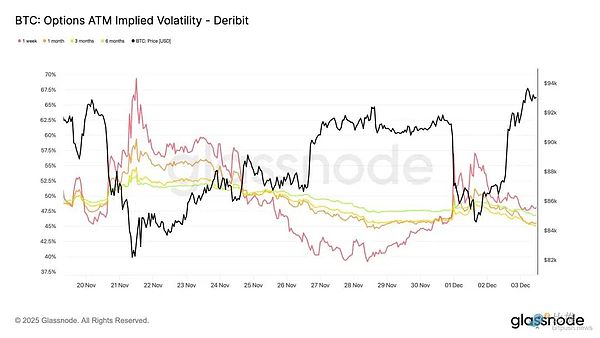
Implied volatility (IV) resets across the board
Turning to the options market, implied volatility (IV) provides a clear window into how traders are pricing future uncertainty.As a starting point, tracking implied volatility is useful because it reflects the market’s expectations of future price movements.Implied volatility has reset lower after last week’s elevated readings.Price struggled to break through the 92K resistance level, and the rebound lacked follow-up momentum, prompting volatility sellers to re-enter and push implied volatility lower across the board:
-
Short-term contracts fell from 57% to 48%
-
Mid-term contracts reduced from 52% to 45%
-
Long-term contracts fell from 49% to 47%
This continued decline suggests traders see a sharp downside as less likely and anticipate calmer conditions in the near term.
The reset also marks a shift toward a more neutral stance, with markets emerging from last week’s heightened caution.
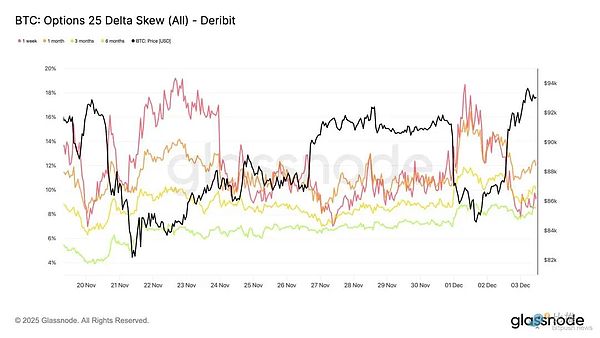
Bearish Skew Easing
After looking at implied volatility, skew helps clarify how traders assess downside versus upside risk.It measures the difference between the implied volatility of put and call options.
When skewness is positive, traders pay a premium for downside protection; when skewness is negative, they pay more for upside exposure.The direction of skewness is equally important as the level.
For example, a short-term skewness of 8% would convey a very different message if it were falling from 18% over two days rather than rising from negative territory.
Short-term skewness moved from 18.6% on Monday (during the decline to 84.5K driven by the Japanese bond narrative) to 8.4% on the rebound.
This suggests that the initial reaction was exaggerated.Longer-dated contracts have been slower to adjust, suggesting traders are willing to chase short-term upside but remain uncertain about its durability.
fear subsides
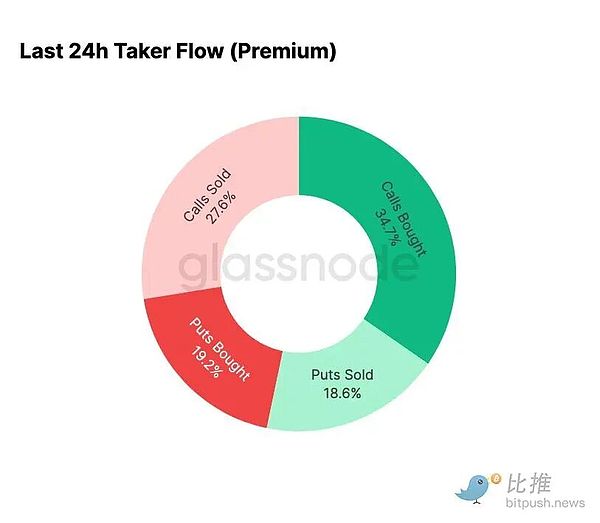
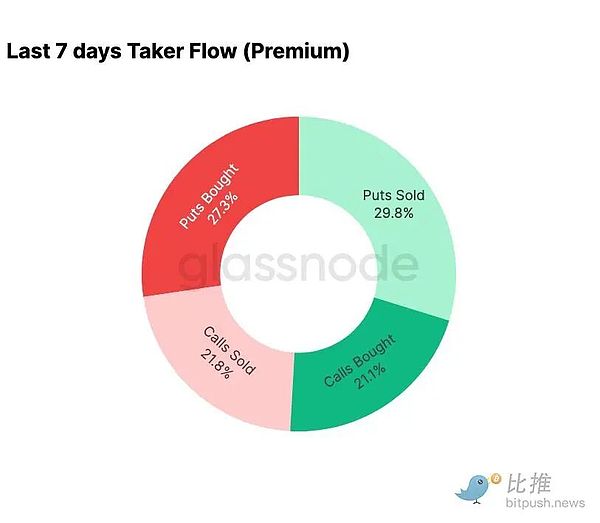
Fund flow data shows a stark contrast between the past seven days and the subsequent rebound.
Earlier in the week, activity was dominated by put buying, reflecting fears of a repeat of the August 2024 price action, which was linked to concerns about a potential Japan carry trade unwinding.Because this risk has been experienced before, markets already have a feel for how widespread the contagion could be and the recovery that typically ensues.Once prices stabilized, flows quickly shifted: The rebound brought a decisive tilt toward call options activity, an almost perfect reversal of the pattern seen during periods of stress.
Notably, traders remain net-long Gamma at current levels and will likely remain so until December 26, the year’s largest expiration date.This position typically dampens price volatility.Once that expiration date passes, positions will reset and the market will enter 2026 with a new set of dynamics.
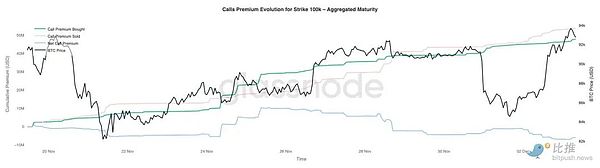
$100,000 Call Option Premium Evolution
Focusing on the call premium at the $100,000 strike price can help clarify how traders treat this key psychological level.On the right side of the chart, call selling premiums remain higher than call buying premiums, and the gap between the two has widened during the rally over the past 48 hours.This expansion suggests that belief in recovering $100,000 remains limited.This level is likely to attract resistance, especially if implied volatility compresses on an upward move and rebuilds on a downward move.This pattern reinforces the mean-reverting behavior of implied volatility within the current range.
The premium profile also shows that traders are not taking positions for an aggressive breakout ahead of the FOMC meeting.Instead, flows reflect a more cautious stance, with upside being sold rather than chased.As a result, the recent recovery lacks the conviction typically needed to challenge the important $100,000 level.
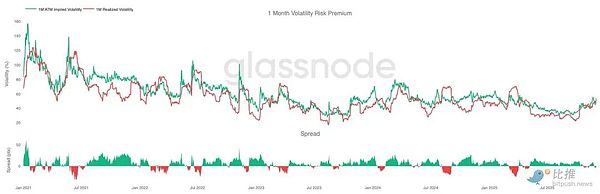
Volatility is undervalued
When we combine the reset in implied volatility with the sharp moves in both directions this week, the result is a negative volatility risk premium.Volatility risk premiums are typically positive because traders require compensation for the risk of volatility spikes.Without this premium, traders shorting volatility cannot monetize the risk they take.
At current levels, implied volatility is lower than realized volatility, meaning options are priced with less volatility than the market actually delivers.This creates a favorable environment for taking a long Gamma position, as every price swing can lead to gains, as long as the actual move exceeds the expectations implicit in the option price.
Conclusion
Bitcoin continues to trade in a structurally fragile environment, with on-chain weakness and shrinking demand intertwined with a more cautious derivatives landscape.Prices have temporarily stabilized above the “real market mean”, but the broader structure is now highly similar to Q1 2022: more than 25% of supply is underwater, realized losses are increasing, and sensitivity to macro shocks is heightened.Although far weaker than earlier this year, positive capital momentum remains one of the few constructive signals preventing a deeper collapse in the market.
Off-chain indicators reinforced this defensive tone.ETF capital flows have turned into net outflows, spot CVD indicators have fallen, and futures open positions have continued to decrease in an orderly manner.Funding rates are close to neutral, reflecting neither bullish confidence nor active short pressure.In options markets, implied volatility has compressed, skewness has softened, fund flows have reversed, and options are currently underpriced relative to realized volatility, signaling caution rather than renewed risk appetite.
Looking to the future,Staying within the 0.75-0.85 quantile range ($96.1K-106K) is crucial to stabilizing the market structure and reducing downside vulnerability before the end of the year.Conversely, the “real market mean” remains the most likely area for bottom formation, unless negative macro catalysts disrupt the market’s already delicate balance.


